SBASAQ9 October 2023 ADC12QJ1600-SEP
PRODUCTION DATA
- 1
- 1 Features
- 2 Applications
- 3 Description
- 4 Pin Configuration and Functions
-
5 Specifications
- 5.1 Absolute Maximum Ratings
- 5.2 ESD Ratings
- 5.3 Recommended Operating Conditions
- 5.4 Thermal Information
- 5.5 Electrical Characteristics: DC Specifications
- 5.6 Electrical Characteristics: Power Consumption
- 5.7 Electrical Characteristics: AC Specifications
- 5.8 Switching Characteristics
- 5.9 Timing Requirements
- 5.10 Typical Characteristics
-
6 Detailed Description
- 6.1 Overview
- 6.2 Functional Block Diagram
- 6.3
Feature Description
- 6.3.1 Analog Input
- 6.3.2 Temperature Monitoring Diode
- 6.3.3 Timestamp
- 6.3.4 Clocking
- 6.3.5
JESD204C Interface
- 6.3.5.1 Transport Layer
- 6.3.5.2 Scrambler
- 6.3.5.3 Link Layer
- 6.3.5.4 8B or 10B Link Layer
- 6.3.5.5 64B or 66B Link Layer
- 6.3.5.6 Physical Layer
- 6.3.5.7 JESD204C Enable
- 6.3.5.8 Multi-Device Synchronization and Deterministic Latency
- 6.3.5.9 Operation in Subclass 0 Systems
- 6.3.5.10 Alarm Monitoring
- 6.4
Device Functional Modes
- 6.4.1 Low Power Mode and High Performance Mode
- 6.4.2 JESD204C Modes
- 6.4.3 Power-Down Modes
- 6.4.4 Test Modes
- 6.4.5 Calibration Modes and Trimming
- 6.4.6 Offset Calibration
- 6.4.7 Trimming
- 6.5 Programming
- 7 Application and Implementation
- 8 Device and Documentation Support
- 9 Revision History
- 10Mechanical, Packaging, and Orderable Information
Package Options
Refer to the PDF data sheet for device specific package drawings
Mechanical Data (Package|Pins)
- ALR|144
Thermal pad, mechanical data (Package|Pins)
Orderable Information
7.2.1.3 Application Curves
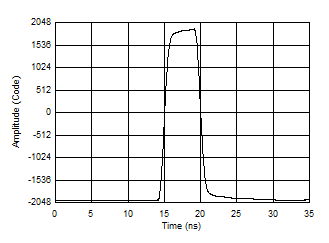
An example pulse measurement using the device is shown in Figure 7-2. The setup follows the example LiDAR system requirements with a 5-ns pulse captured at 1 GSPS. The applied pulse has a rise and fall time of approximately 1 ns. A sub-sampling technique is used to interpolate data points to form an equivalent 32 GSPS capture of the pulse for more accurate details and multiple capture averaging is used to suppress noise. A negative DC bias is applied to the ADC to enable use of the full dynamic range of the ADC for unipolar pulses. The pulse is spanning almost the full range of ADC codes. The extracted pulse parameters are given in Table 7-3. The analog front-end is not included in this measurement.
 Figure 7-2 Measured Pulse using Sub-Sampling Technique for Equivalent 32 GSPS
Measurement
Figure 7-2 Measured Pulse using Sub-Sampling Technique for Equivalent 32 GSPS
Measurement| Measured Parameter | Measured Value | Units |
|---|---|---|
| Rise Time (10-90%) | 1.18 | ns |
| Fall Time (90-10%) | 1.19 | ns |
| Pulse Width (50%) | 4.99 | ns |
| Equivalent Bandwidth(1) | 295.3 | MHz |
| Peak Amplitude (Codes) | 3901 | LSB |
| Peak Amplitude (Voltage) | 750.5 | mV |
| DC Offset (Codes) | -1994 | LSB |
| DC Offset (Voltage) | -383.7 | mV |