SLVSDU6D July 2017 – November 2019 ATL431LI , ATL432LI
PRODUCTION DATA.
- 1 Features
- 2 Applications
- 3 Description
- 4 Revision History
- 5 Device Comparison Table
- 6 Pin Configuration and Functions
- 7 Specifications
- 8 Typical Characteristics
- 9 Parameter Measurement Information
- 10Detailed Description
- 11Applications and Implementation
- 12Power Supply Recommendations
- 13Layout
- 14Device and Documentation Support
- 15Mechanical, Packaging, and Orderable Information
Package Options
Mechanical Data (Package|Pins)
Thermal pad, mechanical data (Package|Pins)
- DQN|4
Orderable Information
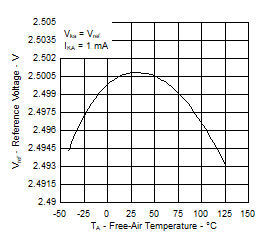
8 Typical Characteristics
Data at high and low temperatures are applicable only within the recommended operating free-air temperature ranges of the various devices.
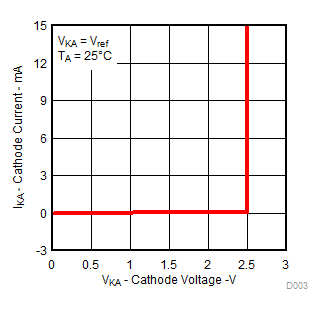 Figure 3. Cathode Current vs Cathode Voltage
 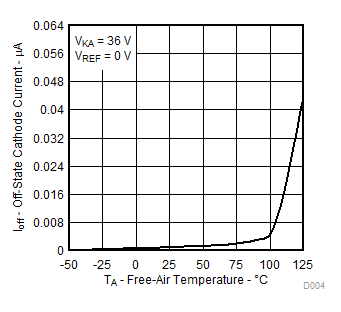 Figure 5. Off-State Cathode Current
vs Free-Air Temperature
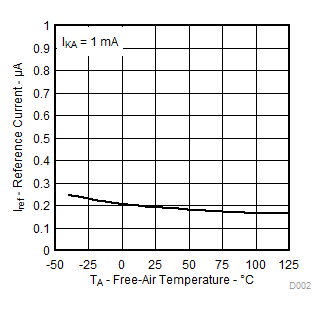 Figure 2. Reference Current vs Free-Air Temperature
 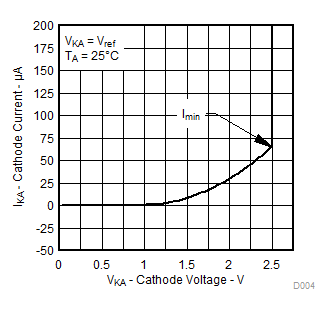 Figure 4. Cathode Current vs Cathode Voltage
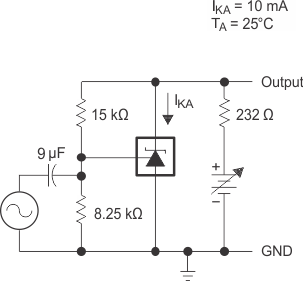
 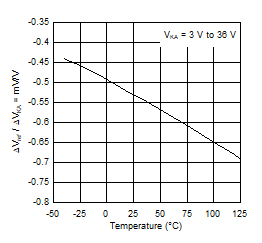 Figure 6. Ratio of Delta Reference Voltage to Delta Cathode Voltage vs Free-Air Temperature
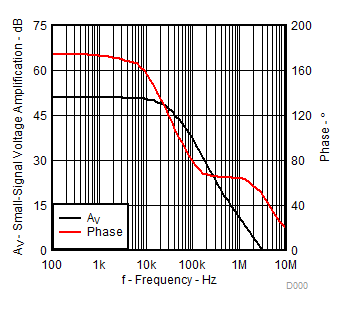
vs Frequency
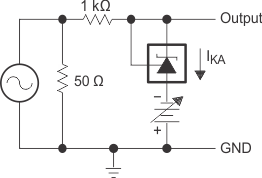
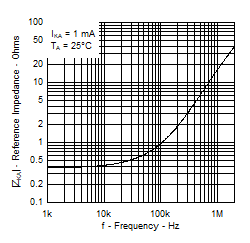 Figure 9. Reference Impedance vs Frequency
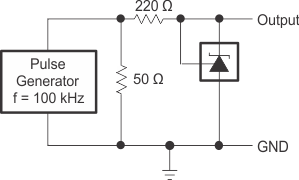
 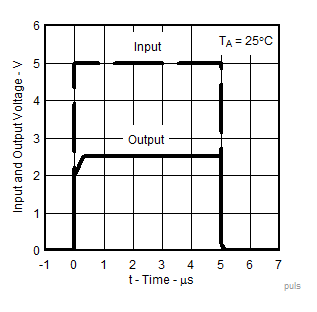 Figure 11. Pulse Response
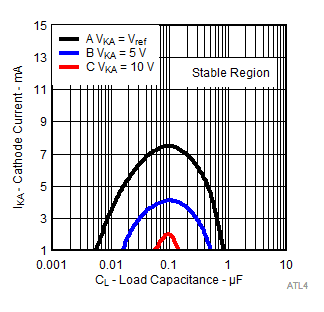
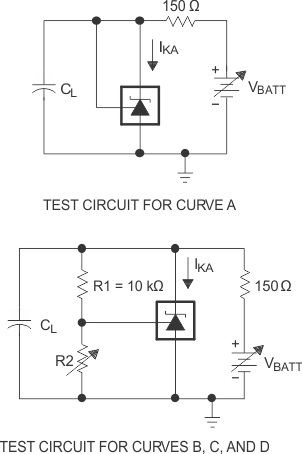
The areas under the curves represent conditions that may cause the device to oscillate. For curves B and C, R2 and V+ are adjusted to establish the initial VKA and IKA conditions, with CL = 0. VBATT and CL then are adjusted to determine the ranges of stability.
Figure 13. Stability Boundary Conditions for All ATL431LI, ATL432LI Devices Above 1 mA 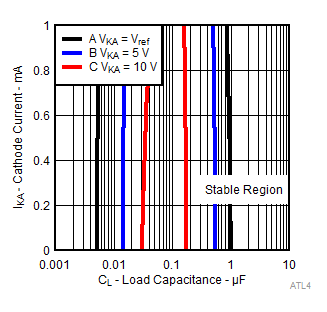
A. The areas in-between the curves represent conditions that may cause the device to oscillate. For curves B, and C, R2 and V+ are adjusted to establish the initial VKA and IKA conditions, with CL = 0. VBATT and CL then are adjusted to determine the ranges of stability.
Figure 15. Stability Boundary Conditions for All ATL431LI, ATL432LI Devices Below 1 mA 