SNLS374D May 1998 – January 2015 DS8921
PRODUCTION DATA.
- 1 Features
- 2 Applications
- 3 Description
- 4 Revision History
- 5 Pin Configuration and Functions
-
6 Specifications
- 6.1 Absolute Maximum Ratings
- 6.2 ESD Ratings
- 6.3 Recommended Operating Conditions
- 6.4 Electrical Characteristics
- 6.5 Receiver Switching Characteristics
- 6.6 Driver Switching Characteristics: Single-Ended Characteristics
- 6.7 Driver Switching Characteristics: Differential Characteristics
- 6.8 Typical Characteristics
- 7 Parameter Measurement Information
- 8 Detailed Description
- 9 Application and Implementation
- 10Power Supply Recommendations
- 11Layout
- 12Device and Documentation Support
- 13Mechanical, Packaging, and Orderable Information
Package Options
Mechanical Data (Package|Pins)
- D|8
Thermal pad, mechanical data (Package|Pins)
Orderable Information
6 Specifications
6.1 Absolute Maximum Ratings(1)(2)
| MIN | MAX | UNIT | |
|---|---|---|---|
| Supply Voltage | 7 | V | |
| Driver Input Voltage | −0.5 | 7 | V |
| Output Voltage | 5.5 | V | |
| Receiver Output Sink Current | 50 | mA | |
| Receiver Input Voltage | –10 | 10 | V |
| Differential Input Voltage | –12 | 12 | V |
| Maximum Package Power Dissipation at 25°C: D Package | 730 | mW | |
| Maximum Package Power Dissipation at 25°C: P Package | 1160 | mW | |
| Derate D Package, above 25°C | 9.3 | mW/°C | |
| Derate P Package, above 25°C | 5.8 | mW/°C | |
| Lead Temperature | 260 | °C | |
| (Soldering, 4 sec.) | 260 | °C | |
| Maximum Junction Temperature | 150 | °C | |
| Storage Temperature, Tstg | −65 | 165 | °C |
(1) Stresses beyond those listed under Absolute Maximum Ratings may cause permanent damage to the device. These are stress ratings only, which do not imply functional operation of the device at these or any other conditions beyond those indicated under Recommended Operating Conditions. Exposure to absolute-maximum-rated conditions for extended periods may affect device reliability.
(2) If Military/Aerospace specified devices are required, please contact the Texas Instrument Sales Office/ Distributors for availability and specifications.
6.2 ESD Ratings
| VALUE | UNIT | |||
|---|---|---|---|---|
| V(ESD) | Electrostatic discharge | Human-body model (HBM), per ANSI/ESDA/JEDEC JS-001(1) | ±2000 | V |
| Charged-device model (CDM), per JEDEC specification JESD22-C101(2) | ±1500 | |||
(1) JEDEC document JEP155 states that 500-V HBM allows safe manufacturing with a standard ESD control process.
(2) JEDEC document JEP157 states that 250-V CDM allows safe manufacturing with a standard ESD control process.
6.3 Recommended Operating Conditions
| MIN | MAX | UNIT | |
|---|---|---|---|
| Supply Voltage | 4.5 | 5.5 | V |
| Temperature (TA): DS8921/DS8921A | 0 | 70 | °C |
| Temperature (TA): DS8921AT | −40 | 85 | °C |
6.4 Electrical Characteristics
Over operating free-air temperature range unless otherwise noted.(1)(2)(3)| TEST CONDITIONS | MIN | TYP | MAX | UNIT | |
|---|---|---|---|---|---|
| RECEIVER | |||||
| VTH | −7 V ≤ VCM ≤ +7 V | −200 | ±35 | +200 | mV |
| VHYST | −7 V ≤ VCM ≤ +7 V | 15 | 70 | mV | |
| RIN | VIN = −7 V, +7 V, (Other Input = GND) | 4.0 | 6.0 | kΩ | |
| IIN | VIN = 10 V | 3.25 | mA | ||
| VIN = −10 V | −3.25 | mA | |||
| VOH | IOH = −400 μA | 2.5 | V | ||
| VOL | IOL = 8 mA | 0.5 | V | ||
| ISC | VCC = MAX, VOUT = 0 V | −15 | −100 | mA | |
| DRIVER | |||||
| VIH | 2.0 | V | |||
| VIL | 0.8 | V | |||
| IIL | VCC = MAX, VIN = 0.4 V | −40 | −200 | μA | |
| IIH | VCC = MAX, VIN = 2.7 V | 20 | μA | ||
| II | VCC = MAX, VIN = 7.0 V | 100 | μA | ||
| VCL | VCC = MIN, IIN = −18 mA | −1.5 | V | ||
| VOH | VCC = MIN, IOH = −20 mA | 2.5 | V | ||
| VOL | VCC = MIN, IOL = +20 mA | 0.5 | V | ||
| IOFF | VCC = 0V, V OUT = 5.5 V | 100 | μA | ||
| |VT| – |VT| | 0.4 | V | |||
| VT | 2.0 | V | |||
| |VOS – VOS| | 0.4 | V | |||
| ISC | VCC = MAX, VOUT = 0 V | −30 | −150 | mA | |
| DRIVER AND RECEIVER | |||||
| ICC | VCC = MAX, VOUT = Logic 0 | 35 | mA | ||
(1) All currents into device pins are shown as positive values; all currents out of the device are shown as negative; all voltages are referenced to ground unless otherwise specified. All values shown as max or min are classified on absolute value basis.
(2) All typical values are VCC = 5 V, TA = 25°C.
(3) Only one output at a time should be shorted.
6.5 Receiver Switching Characteristics
| TEST CONDITIONS | MIN | TYP | MAX 8921 |
MAX 8921A |
MAX 8921AT |
UNIT | |
|---|---|---|---|---|---|---|---|
| tpLH | CL = 30 pF | 14 | 22.5 | 20 | 20 | ns | |
| (Figure 3 and Figure 4) | |||||||
| tpHL | CL = 30 pF | 14 | 22.5 | 20 | 20 | ns | |
| (Figure 3 and Figure 4) | |||||||
| |tpLH–t pHL| | CL = 30 pF | 0.5 | 5 | 3.5 | 5 | ns | |
| (Figure 3 and Figure 4) | |||||||
6.6 Driver Switching Characteristics: Single-Ended Characteristics
| TEST CONDITIONS | MIN | TYP | MAX 8921 |
MAX 8921A |
MAX 8921AT |
UNIT | |
|---|---|---|---|---|---|---|---|
| tpLH | CL = 30 pF | 10 | 15 | 15 | 15 | ns | |
| (Figure 5 and Figure 6) | |||||||
| tpHL | CL = 30 pF | 10 | 15 | 15 | 15 | ns | |
| (Figure 5 and Figure 6) | |||||||
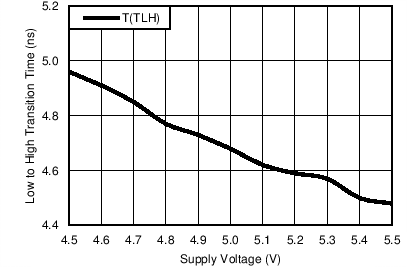
| tTLH | CL = 30 pF | 5 | 8 | 8 | 9.5 | ns | |
| (Figure 9 and Figure 10) | |||||||
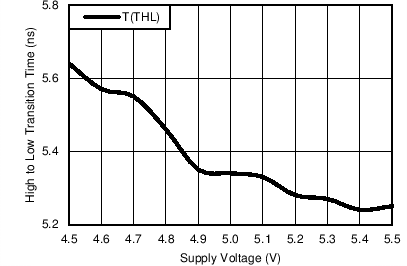
| tTHL | CL = 30 pF | 5 | 8 | 8 | 9.5 | ns | |
| (Figure 9 and Figure 10) | |||||||
| Skew | CL = 30 pF(1) | 1 | 5 | 3.5 | 3.5 | ns | |
| (Figure 5 and Figure 6) | |||||||
(1) Difference between complementary outputs at the 50% point.
6.7 Driver Switching Characteristics: Differential Characteristics(1)
| TEST CONDITIONS | MIN | TYP | MAX 8921 |
MAX 8921A |
MAX 8921AT |
UNIT | |
|---|---|---|---|---|---|---|---|
| tpLH | CL = 30 pF | 10 | 15 | 15 | 15 | ns | |
| (Figure 5, Figure 7, and Figure 8) | |||||||
| tpHL | CL = 30 pF | 10 | 15 | 15 | 15 | ns | |
| (Figure 5, Figure 7, and Figure 8) | |||||||
| |tpLH–t pHL| | CL = 30 pF | 0.5 | 6 | 2.75 | 2.75 | ns | |
| (Figure 5, Figure 7, and Figure 8) | |||||||
(1) Differential Delays are defined as calculated results from single ended rise and fall time measurements. This approach in establishing AC performance specifications has been taken due to limitations of available Automatic Test Equipment (ATE). The calculated ATE results assume a linear transition between measurement points and are a result of the following equations: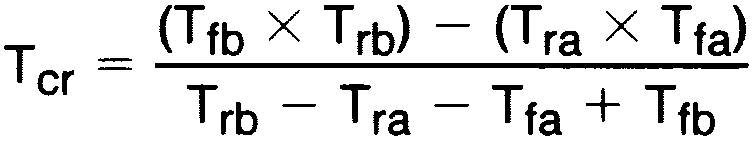 Where: Tcr = Crossing Point Tra, Trb, Tfa and T fb are time measurements with respect to the input. See Figure 8.
Where: Tcr = Crossing Point Tra, Trb, Tfa and T fb are time measurements with respect to the input. See Figure 8.6.8 Typical Characteristics
Test Setup: Figure 5. Data Rate, Test Pattern: 2 Mbps, 1010 Pattern. T: 25°C