SNOSCZ4A April   2015  – October 2024 FDC1004-Q1

PRODUCTION DATA  

  1.   1
  2. Features
  3. Applications
  4. Description
  5. Pin Configuration and Functions
  6. Specifications
    1. 5.1 Absolute Maximum Ratings
    2. 5.2 ESD Ratings
    3. 5.3 Recommended Operating Conditions
    4. 5.4 Thermal Information
    5. 5.5 Electrical Characteristics
    6. 5.6 I2C Interface Voltage Level
    7. 5.7 I2C Interface Timing
    8. 5.8 Typical Characteristics
  7. Detailed Description
    1. 6.1 Overview
    2. 6.2 Functional Block Diagram
    3. 6.3 Feature Description
      1. 6.3.1 The Shield
      2. 6.3.2 The CAPDAC
      3. 6.3.3 Capacitive System Offset Calibration
      4. 6.3.4 Capacitive Gain Calibration
    4. 6.4 Device Functional Modes
      1. 6.4.1 Single Ended Measurement
      2. 6.4.2 Differential Measurement
    5. 6.5 Programming
      1. 6.5.1 Serial Bus Address
      2. 6.5.2 Read/Write Operations
      3. 6.5.3 Device Usage
        1. 6.5.3.1 Measurement Configuration
        2. 6.5.3.2 Triggering Measurements
        3. 6.5.3.3 Wait for Measurement Completion
        4. 6.5.3.4 Read of Measurement Result
    6. 6.6 Register Maps
      1. 6.6.1 Registers
        1. 6.6.1.1 Capacitive Measurement Registers
      2. 6.6.2 Measurement Registers
      3. 6.6.3 Measurement Configuration Registers
      4. 6.6.4 FDC Configuration Register
      5. 6.6.5 Offset Calibration Registers
      6. 6.6.6 Gain Calibration Registers
      7. 6.6.7 Manufacturer ID Register
      8. 6.6.8 Device ID Register
  8. Applications and Implementation
    1. 7.1 Application Information
      1. 7.1.1 Liquid Level Sensor
    2. 7.2 Typical Application
      1. 7.2.1 Design Requirements
      2. 7.2.2 Detailed Design Procedure
      3. 7.2.3 Application Curve
    3. 7.3 Best Design Practices
    4. 7.4 Initialization Set Up
    5. 7.5 Power Supply Recommendations
    6. 7.6 Layout
      1. 7.6.1 Layout Guidelines
      2. 7.6.2 Layout Example
  9. Device and Documentation Support
    1. 8.1 Documentation Support
      1. 8.1.1 Related Documentation
    2. 8.2 Receiving Notification of Documentation Updates
    3. 8.3 Support Resources
    4. 8.4 Trademarks
    5. 8.5 Electrostatic Discharge Caution
    6. 8.6 Glossary
  10. Revision History
  11. 10Mechanical, Packaging, and Orderable Information

Package Options

Mechanical Data (Package|Pins)
Thermal pad, mechanical data (Package|Pins)
Orderable Information

Application Curve

The data shown below has been collected with the FDC1004QEVM. A liquid level sensor with 3 electrodes like the one shown in the schematic was connected to the EVM. The plot shows the capacitance measured by the 3 electrodes at different levels of liquid in the tank. The capacitance of the Reference Liquid (the RF trace in the graph below) and Reference Environmental (the RE trace) sensors have a steady value when the liquid is above their height while the capacitance of the level sensor (Level) increases linearly with the height of the liquid in the tank.
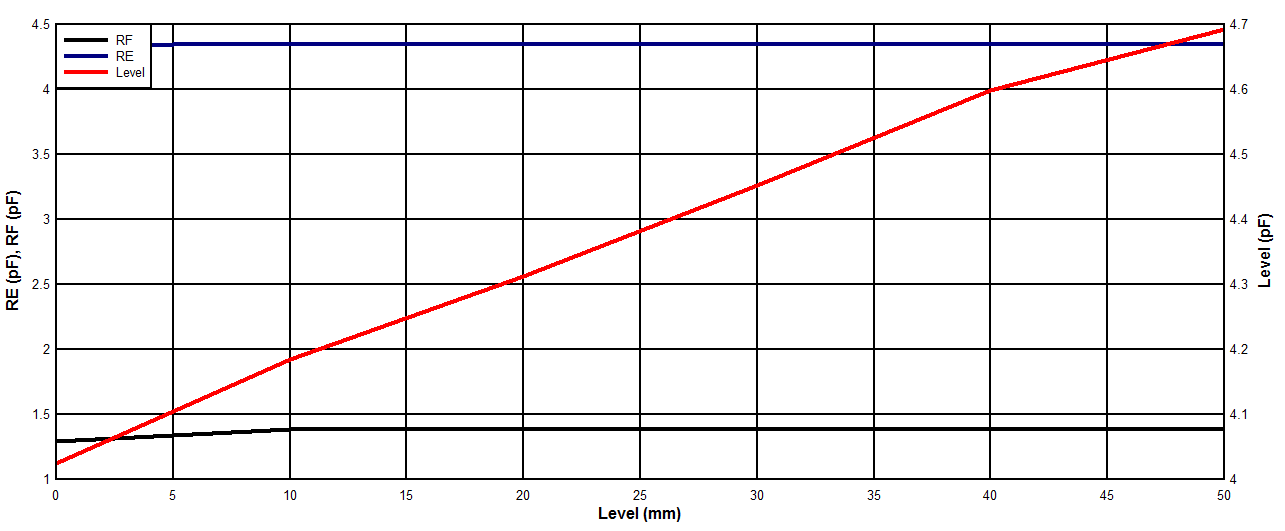
FDC1004-Q1 Electrode Capacitance vs
          Liquid LevelFigure 7-2 Electrode Capacitance vs Liquid Level