SBOS673D September 2017 – December 2018 OPA2837 , OPA837
PRODUCTION DATA.
- 1 Features
- 2 Applications
- 3 Description
- 4 Revision History
- 5 Pin Configuration and Functions
-
6 Specifications
- 6.1 Absolute Maximum Ratings
- 6.2 ESD Ratings
- 6.3 Recommended Operating Conditions
- 6.4 Thermal Information: OPA837
- 6.5 Thermal Information: OPA2837
- 6.6 Electrical Characteristics: VS = 5 V
- 6.7 Electrical Characteristics: VS = 3 V
- 6.8 Typical Characteristics: VS = 5.0 V
- 6.9 Typical Characteristics: VS = 3.0 V
- 6.10 Typical Characteristics: ±2.5-V to ±1.5-V Split Supply
- 7 Detailed Description
-
8 Application and Implementation
- 8.1
Application Information
- 8.1.1 Noninverting Amplifier
- 8.1.2 Inverting Amplifier
- 8.1.3 Output DC Error Calculations
- 8.1.4 Output Noise Calculations
- 8.1.5 Instrumentation Amplifier
- 8.1.6 Attenuators
- 8.1.7 Differential to Single-Ended Amplifier
- 8.1.8 Differential-to-Differential Amplifier
- 8.1.9 Pulse Application With Single-Supply Circuit
- 8.1.10 ADC Driver Performance
- 8.2 Typical Applications
- 8.1
Application Information
- 9 Power Supply Recommendations
- 10Layout
- 11Device and Documentation Support
- 12Mechanical, Packaging, and Orderable Information
Package Options
Mechanical Data (Package|Pins)
Thermal pad, mechanical data (Package|Pins)
- RUN|10
Orderable Information
6.9 Typical Characteristics: VS = 3.0 V
at VS+ = 3.0 V, VS– = 0 V, VOUT = 1 VPP, RF = 0 Ω, RL = 2 kΩ, G = 1 V/V, input and output referenced to mid-supply, and TA ≈ 25°C (unless otherwise noted) Figure 19. Noninverting Small-Signal Response vs Gain
  Figure 23. Noninverting Response Flatness vs Gain
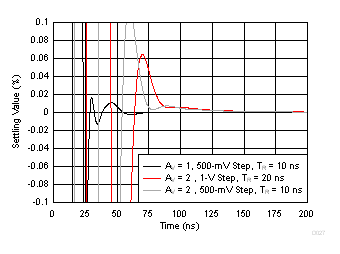
  Figure 25. Noninverting Step Response vs VOPP
  Figure 31. Harmonic Distortion vs Frequency
  Figure 33. Harmonic Distortion vs Output Swing
| See Figure 87, gain = 1 V/V, VOUT = 1 VPP, RLOAD = 2 kΩ | ||
 Figure 20. Inverting Small-Signal Response vs Gain
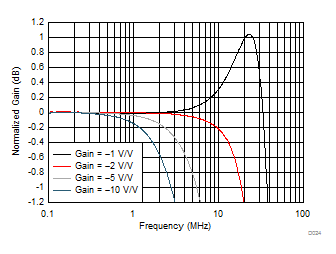
  Figure 24. Inverting Response Flatness vs Gain
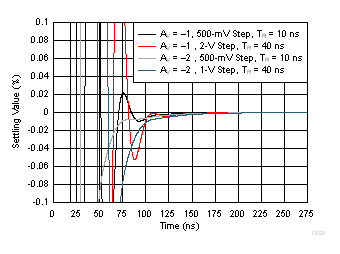
  Figure 26. Inverting Step Response vs VOPP
  Figure 32. Harmonic Distortion vs RLOAD
  Figure 34. Harmonic Distortion vs Gain Magnitude
| See Figure 88, gain of 1 V/V and 2 V/V, VOUT = 1 VPP,
RLOAD = 2 kΩ |


