SLLSEM1B February 2015 – April 2015 SN65LVDS93A-Q1
PRODUCTION DATA.
- 1 Features
- 2 Applications
- 3 Description
- 4 Revision History
- 5 Pin Configuration and Functions
- 6 Specifications
- 7 Parameter Measurement Information
- 8 Detailed Description
- 9 Application and Implementation
- 10Power Supply Recommendations
- 11Layout
- 12Device and Documentation Support
- 13Mechanical, Packaging, and Orderable Information
Package Options
Mechanical Data (Package|Pins)
- DGG|56
Thermal pad, mechanical data (Package|Pins)
Orderable Information
7 Parameter Measurement Information

All input timing is defined at IOVDD / 2 on an input signal with a 10% to 90% rise or fall time of less than 3 ns. CLKSEL = 0 V.
Figure 6. Set Up and Hold Time Definition
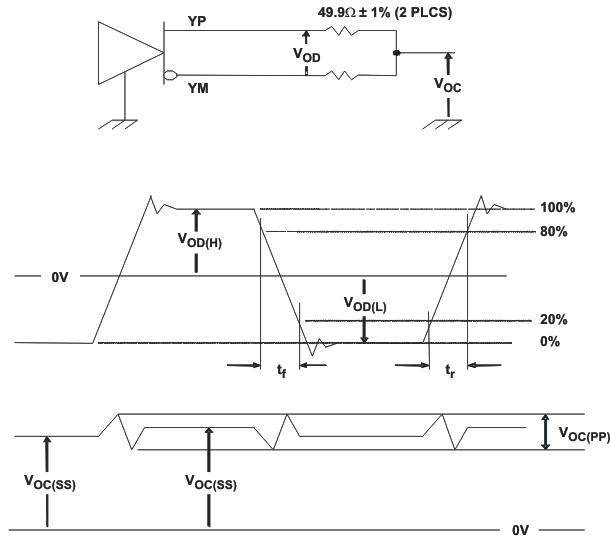
 Figure 7. Test Load and Voltage Definitions for LVDS Outputs

The 16 grayscale test pattern test device power consumption for a typical display pattern.
Figure 8. 16 Grayscale Test Pattern

The worst-case test pattern produces nearly the maximum switching frequency for all of the LVDS outputs.
Figure 9. Worst-Case Power Test Pattern

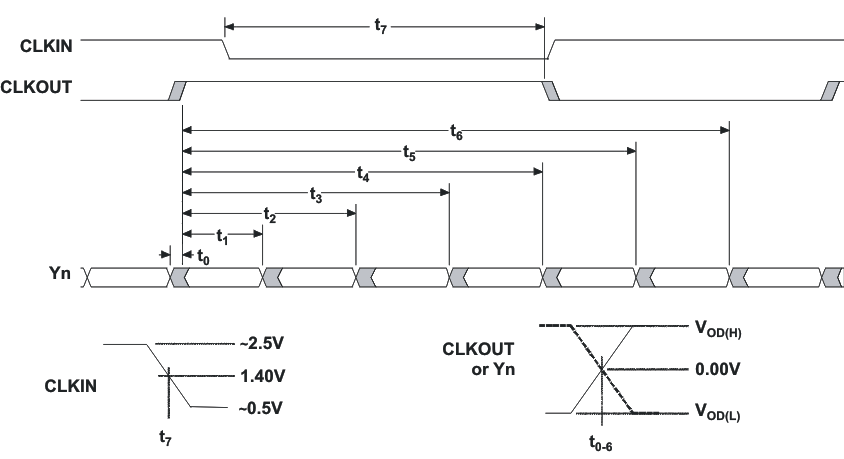
CLKOUT is shown with CLKSEL at high-level.
CLKIN polarity depends on CLKSEL input level.
Figure 10. SN65LVDS93A-Q1 Timing Definitions
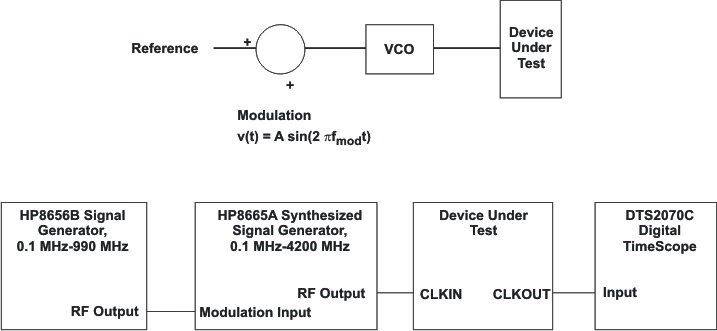
CLKIN polarity depends on CLKSEL input level.
 Figure 11. Output Clock Jitter Test Set Up
 Figure 12. Enable Time Waveforms
 Figure 13. Disable Time Waveforms