SLOS889C October   2014  – September 2018 TMP302-Q1

PRODUCTION DATA.  

  1. Features
  2. Applications
  3. Description
    1.     Device Images
      1.      Trip Threshold Accuracy
  4. Revision History
  5. Device Comparison Table
  6. Pin Configuration and Functions
    1.     Pin Functions
  7. Specifications
    1. 7.1 Absolute Maximum Ratings
    2. 7.2 ESD Ratings
    3. 7.3 Recommended Operating Conditions
    4. 7.4 Thermal Information
    5. 7.5 Electrical Characteristics
    6. 7.6 Typical Characteristics
  8. Detailed Description
    1. 8.1 Overview
    2. 8.2 Functional Block Diagram
    3. 8.3 Feature Description
      1. 8.3.1 HYSTSET
    4. 8.4 Device Functional Modes
  9. Application and Implementation
    1. 9.1 Application Information
      1. 9.1.1 Configuring the TMP302-Q1
    2. 9.2 Typical Application
      1. 9.2.1 Design Requirements
      2. 9.2.2 Detailed Design Procedure
      3. 9.2.3 Application Curves
  10. 10Power Supply Recommendations
  11. 11Layout
    1. 11.1 Layout Guidelines
    2. 11.2 Layout Example
  12. 12Device and Documentation Support
    1. 12.1 Receiving Notification of Documentation Updates
    2. 12.2 Community Resource
    3. 12.3 Trademarks
    4. 12.4 Electrostatic Discharge Caution
    5. 12.5 Glossary
  13. 13Mechanical, Packaging, and Orderable Information

Package Options

Mechanical Data (Package|Pins)
Thermal pad, mechanical data (Package|Pins)
Orderable Information

Typical Characteristics

At TA = 25°C and VS = 3.3 V, unless otherwise noted.
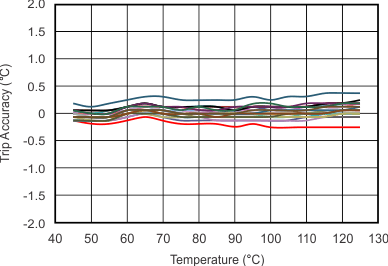
TMP302-Q1 tc_trip_acc_err_temp_slos889.gif
30 typical units
Figure 1. Trip Accuracy Error vs Temperature
TMP302-Q1 tc_iq_temp_slos889.gif
Figure 2. Quiescent Current vs Temperature
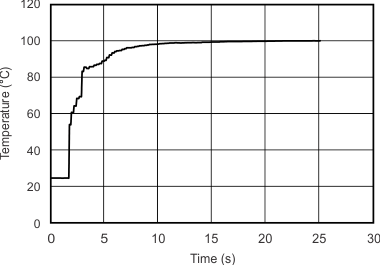
TMP302-Q1 tc_temp_step_resp_time_slos889.gif
Figure 3. Temperature Step Response in Perfluorinated Fluid at 100°C vs Time
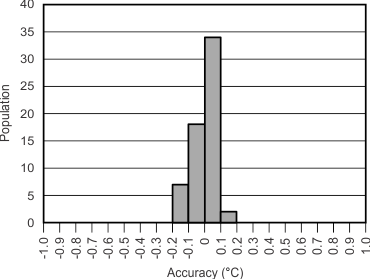
TMP302-Q1 tc_trip_thresh_histo_slos889.gif
Figure 5. Trip Threshold Accuracy
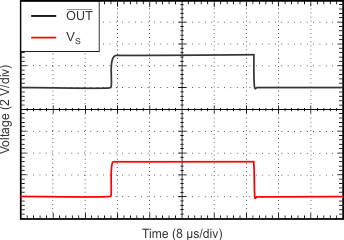
TMP302-Q1 tc_pu_pd_tr_slos889.gif
Figure 7. Power-Up and Power-Down Response
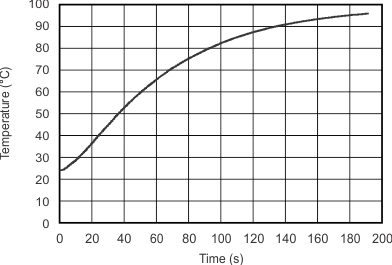
TMP302-Q1 tc_therm_step_resp_air_time_slos889.gif
Figure 4. Thermal Step Response in Air at 100°C vs Time
TMP302-Q1 tc_output_log_low_temp_slos889.gif
VS = 1.4 V IOL = 2 mA
Figure 6. Output Logic-Level Low VOL vs Temperature
TMP302-Q1 tc_pu_trip_pd_tr_slos889.gif
TMP302A-Q1, TA = 55°C TRIPSET1 = TRIPSET0 = GND
Figure 8. Power-Up, Trip, and Power-Down Response