SLVS646B September   2006  – November 2018 TPS2376-H

PRODUCTION DATA.  

  1. Features
  2. Applications
  3. Description
    1.     Device Images
      1.      Typical Application Circuit
  4. Revision History
  5. Device Comparison Table
  6. Pin Configuration and Functions
    1.     Pin Functions
  7. Specifications
    1. 7.1 Absolute Maximum Ratings
    2. 7.2 ESD Ratings
    3. 7.3 ESD Ratings IEC
    4. 7.4 Recommended Operating Conditions
    5. 7.5 Thermal Information
    6. 7.6 Electrical Characteristics
    7. 7.7 Typical Characteristics
  8. Detailed Description
    1. 8.1 Overview
    2. 8.2 Functional Block Diagram
    3. 8.3 Feature Description
      1. 8.3.1 Undervoltage Lockout (UVLO)
      2. 8.3.2 Programmable Inrush Current Limit and Fixed Operational Current Limit
      3. 8.3.3 Power Good
  9. Application and Implementation
    1. 9.1 Application Information
      1. 9.1.1 Internal Thresholds
      2. 9.1.2 Detection
      3. 9.1.3 Classification
    2. 9.2 Typical Application
      1. 9.2.1 External Components
        1. 9.2.1.1 Detection Resistor and UVLO Divider
        2. 9.2.1.2 Magnetics
        3. 9.2.1.3 Input Diodes or Diode Bridges
        4. 9.2.1.4 Input Capacitor
        5. 9.2.1.5 Load Capacitor
        6. 9.2.1.6 Transient Suppressor
  10. 10Power Supply Recommendations
    1. 10.1 Maintain Power Signature
    2. 10.2 DC/DC Converter Startup
    3. 10.3 Auxiliary Power Source ORing
  11. 11Layout
    1. 11.1 Layout Guidelines
    2. 11.2 Layout Example
    3. 11.3 Thermal Protection
    4. 11.4 ESD
  12. 12Device and Documentation Support
    1. 12.1 Documentation Support
      1. 12.1.1 Related Documentation
    2. 12.2 Receiving Notification of Documentation Updates
    3. 12.3 Community Resources
    4. 12.4 Trademarks
    5. 12.5 Electrostatic Discharge Caution
    6. 12.6 Glossary
  13. 13Mechanical, Packaging, and Orderable Information

Package Options

Mechanical Data (Package|Pins)
Thermal pad, mechanical data (Package|Pins)
Orderable Information

Typical Characteristics

Graphs over temperature are interpolations between the marked data points.
TPS2376-H iobias_v_det_lvs646.gif
Figure 1. I(VDD) + I(RTN)
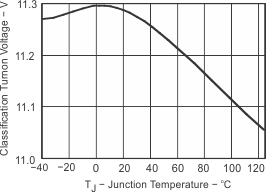
TPS2376-H tonv_v_t_lvs646.gif
Figure 3. Classification Turn On Voltage vs Temperature
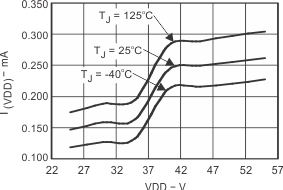
TPS2376-H ivdd_v_v_lvs646.gif
Figure 5. I(VDD) vs VDD
TPS2376-H uvlo76_v_ton_lvs646.gif
Figure 7. UVLO Rising vs Temperature
TPS2376-H inrush_v_tj_lvs646.gif
Figure 9. Inrush Current vs Temperature
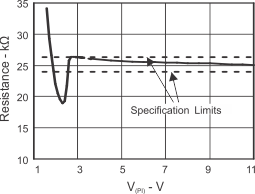
TPS2376-H PDdet_v_Port_lvs570.gif
Figure 2. PD Detection Resistance vs V(PI)
TPS2376-H toffv_v_t_lvs646.gif
Figure 4. Classification Turn Off Voltage vs Temperature
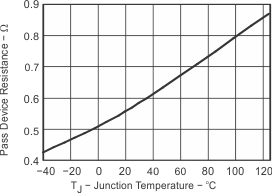
TPS2376-H rdson__v_t_lvs646.gif
Figure 6. Pass Device Resistance vs Temperature
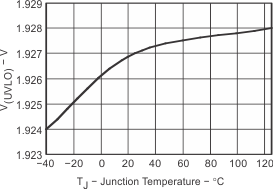
TPS2376-H uvlo76_v_tof_lvs646.gif
Figure 8. UVLO Falling vs Temperature
TPS2376-H current_v_tj_lvs646.gif
Figure 10. Current Limit vs Temperature