JAJSEA5D
December 2017 – October 2019
OPA207
PRODUCTION DATA.
1
特長
2
アプリケーション
3
概要
Device Images
非常に低い0.1Hz~10Hzのノイズ
4
改訂履歴
5
Pin Configuration and Functions
Pin Functions
6
Specifications
6.1
Absolute Maximum Ratings
6.2
ESD Ratings
6.3
Recommended Operating Conditions
6.4
Thermal Information
6.5
Electrical Characteristics
6.6
Typical Characteristics
7
Detailed Description
7.1
Overview
7.2
Functional Block Diagram
7.3
Feature Description
7.3.1
Operating Voltage
7.3.2
Input Protection
7.3.3
ESD Protection
7.3.4
Input Stage Linearization
7.3.5
Rail-to-Rail Output
7.3.6
Low Input Bias Current
7.3.7
Slew Boost
7.3.8
EMI Rejection Ratio (EMIRR)
7.4
Device Functional Modes
8
Application and Implementation
8.1
Application Information
8.2
Typical Applications
8.2.1
Typical OPA207 Application
8.2.1.1
Design Requirements
8.2.1.2
Detailed Design Procedure
8.2.1.3
Application Curve
8.2.2
Precision Low-Side Current Sensing
8.2.3
Precision Buffer With Increased Output Current
9
Power Supply Recommendations
10
Layout
10.1
Layout Guidelines
10.2
Layout Example
11
デバイスおよびドキュメントのサポート
11.1
デバイス・サポート
11.1.1
開発サポート
11.1.1.1
WEBENCH Filter Designerツール
11.1.1.2
TINA-TI(無料のダウンロード・ソフトウェア)
11.1.1.3
TI Precision Designs
11.2
ドキュメントのサポート
11.2.1
関連資料
11.3
ドキュメントの更新通知を受け取る方法
11.4
サポート・リソース
11.5
商標
11.6
静電気放電に関する注意事項
12
メカニカル、パッケージ、および注文情報
パッケージ・オプション
メカニカル・データ(パッケージ|ピン)
D|8
MSOI002K
DGK|8
MPDS028E
DBV|5
MPDS018T
サーマルパッド・メカニカル・データ
発注情報
jajsea5d_oa
jajsea5d_pm
6.6
Typical Characteristics
at T
A
= 25°C, V
S
= ±15 V, and R
L
= 2 kΩ (unless otherwise noted)
Figure 1.
Input Referred Offset Voltage Distribution
Figure 3.
Open-Loop Gain and Phase vs Frequency
Figure 5.
Power Supply Rejection Ratio and Common-Mode Rejection Ratio vs Frequency
Figure 7.
Full Power Bandwidth
Figure 9.
0.1-Hz to 10-Hz Noise Voltage
Figure 11.
Total Harmonic Distortion + Noise vs Output Amplitude
G = +1 V/V
Figure 13.
Overshoot vs Capacitive Load
G = +1 V/V
Figure 15.
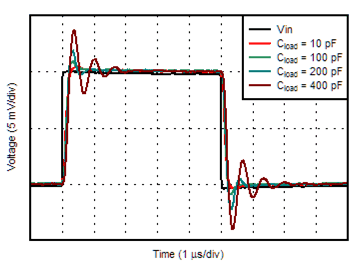
Small-Signal Step Response
G = –1 V/V
Figure 17.
Small-Signal Step Response
Figure 19.
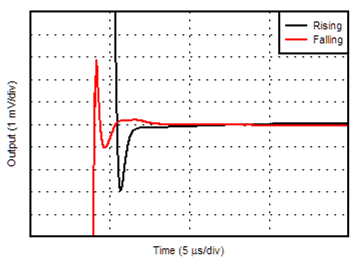
Overload Recovery From Positive Overload
V
OUT
= 3 V
RMS
Figure 21.
Settling Time
Figure 23.
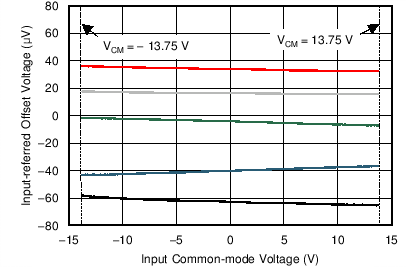
Input Offset Voltage vs Input Common-mode Voltage
Figure 25.
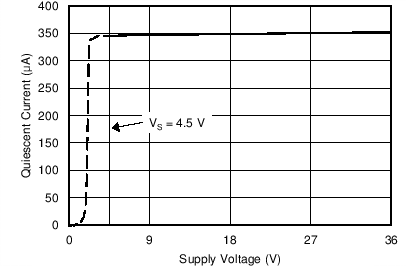
Quiescent Current vs Power Supply Voltage
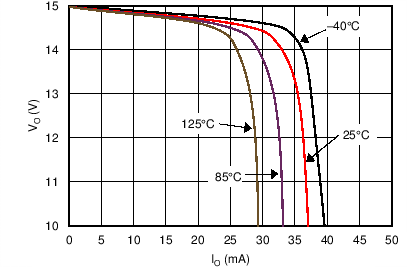
Figure 27.
Output Voltage vs Output Current (Sourcing)
Figure 29.
Input Offset Voltage vs Temperature
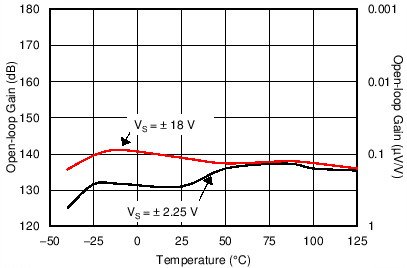
Figure 31.
Open Loop Gain vs Temperature
Figure 33.
Power Supply Rejection Ratio vs Temperature
Figure 35.
Output Short Circuit Current vs Temperature
Figure 2.
Input Referred Offset Voltage Drift Distribution
Figure 4.
Closed Loop Gain vs Frequency
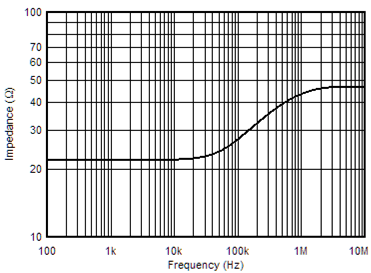
Figure 6.
Open-Loop Output Impedance vs Frequency
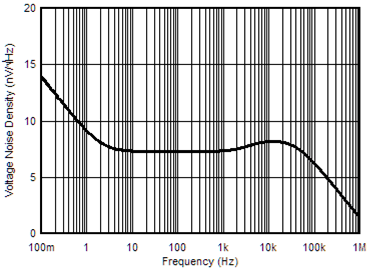
Figure 8.
Input Voltage Noise Spectral Density vs Frequency
Figure 10.
Input Current Noise vs Frequency
V
OUT
= 3 V
RMS
Figure 12.
Total Harmonic Distortion + Noise vs Frequency
G = –1 V/V
Figure 14.
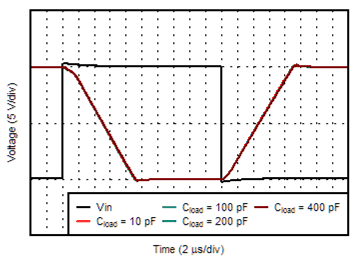
Overshoot vs Capacitive Load
G = +1 V/V
Figure 16.
Large-Signal Step Response
G = –1 V/V
Figure 18.
Large-Signal Step Response
Figure 20.
Overload Recovery from Negative Overload
V
OUT
= 3 V
RMS
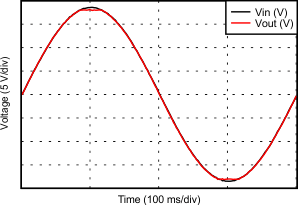
Figure 22.
No Phase Reversal
Figure 24.
Input Bias Current vs Input Common-mode Voltage
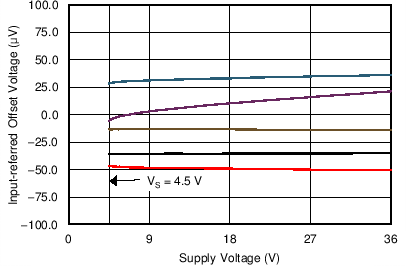
Figure 26.
Input Offset Voltage vs Power Supply Voltage
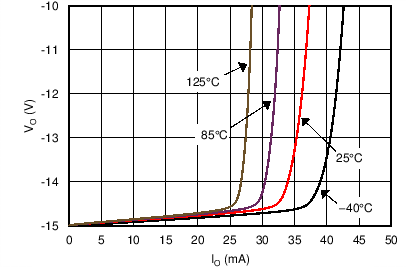
Figure 28.
Output Voltage vs Output Current (Sinking)
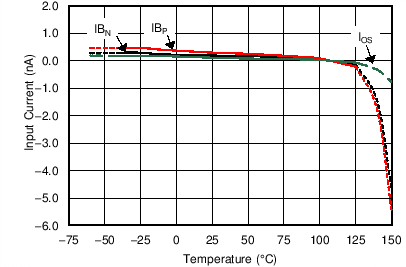
Figure 30.
Input Bias Current vs Temperature
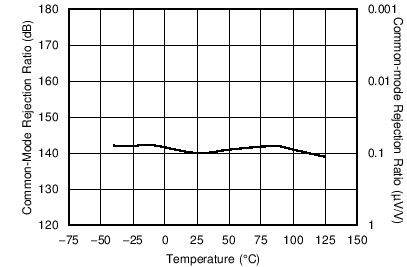
Figure 32.
Common-Mode Rejection Ratio vs Temperature
Figure 34.
Quiescent Current vs Temperature