JAJSGH7B
September 2006 – November 2018
TPS2376-H
PRODUCTION DATA.
1
特長
2
アプリケーション
3
概要
Device Images
代表的なアプリケーション回路
4
改訂履歴
5
Device Comparison Table
6
Pin Configuration and Functions
Pin Functions
7
Specifications
7.1
Absolute Maximum Ratings
7.2
ESD Ratings
7.3
ESD Ratings IEC
7.4
Recommended Operating Conditions
7.5
Thermal Information
7.6
Electrical Characteristics
7.7
Typical Characteristics
8
Detailed Description
8.1
Overview
8.2
Functional Block Diagram
8.3
Feature Description
8.3.1
Undervoltage Lockout (UVLO)
8.3.2
Programmable Inrush Current Limit and Fixed Operational Current Limit
8.3.3
Power Good
9
Application and Implementation
9.1
Application Information
9.1.1
Internal Thresholds
9.1.2
Detection
9.1.3
Classification
9.2
Typical Application
9.2.1
External Components
9.2.1.1
Detection Resistor and UVLO Divider
9.2.1.2
Magnetics
9.2.1.3
Input Diodes or Diode Bridges
9.2.1.4
Input Capacitor
9.2.1.5
Load Capacitor
9.2.1.6
Transient Suppressor
10
Power Supply Recommendations
10.1
Maintain Power Signature
10.2
DC/DC Converter Startup
10.3
Auxiliary Power Source ORing
11
Layout
11.1
Layout Guidelines
11.2
Layout Example
11.3
Thermal Protection
11.4
ESD
12
デバイスおよびドキュメントのサポート
12.1
ドキュメントのサポート
12.1.1
関連資料
12.2
ドキュメントの更新通知を受け取る方法
12.3
コミュニティ・リソース
12.4
商標
12.5
静電気放電に関する注意事項
12.6
Glossary
13
メカニカル、パッケージ、および注文情報
パッケージ・オプション
メカニカル・データ(パッケージ|ピン)
DDA|8
MPDS092F
サーマルパッド・メカニカル・データ
DDA|8
PPTD043J
発注情報
jajsgh7b_oa
jajsgh7b_pm
7.7
Typical Characteristics
Graphs over temperature are interpolations between the marked data points.
A.
Figure 1.
I
(VDD)
+ I
(RTN)
1.
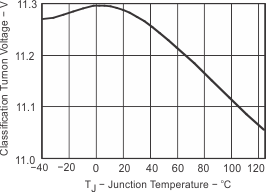
Figure 3.
Classification Turn On Voltage vs Temperature
1.
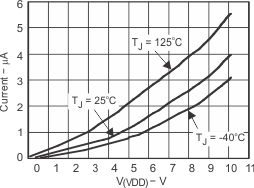
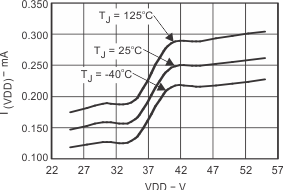
Figure 5.
I
(VDD)
vs VDD
1.
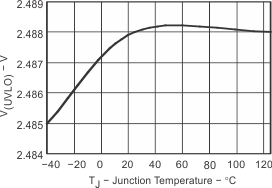
Figure 7.
UVLO Rising vs Temperature
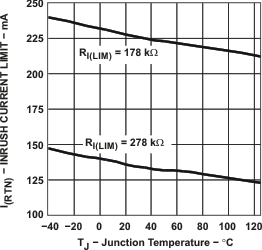
1.
Figure 9.
Inrush Current vs Temperature
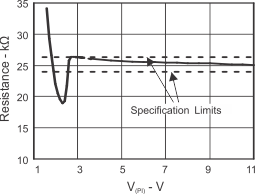
A.
Figure 2.
PD Detection Resistance vs V
(PI)
A.
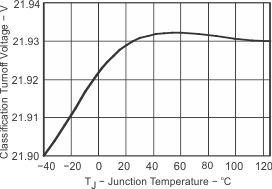
Figure 4.
Classification Turn Off Voltage vs Temperature
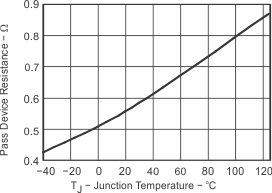
1.
Figure 6.
Pass Device Resistance vs Temperature
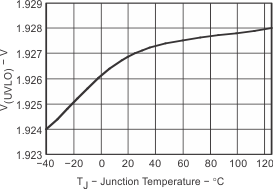
1.
Figure 8.
UVLO Falling vs Temperature
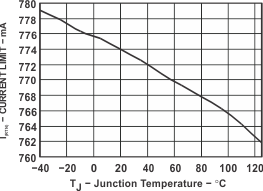
1.
Figure 10.
Current Limit vs Temperature