JAJU680A January 2019 – July 2022
- 概要
- Resources
- 特長
- アプリケーション
- 5
- 1System Description
- 2System Overview
- 3Hardware, Software, Testing Requirements, and Test Results
- 4Design and Documentation Support
- 5About the Authors
- 6Revision History
3.2.2.6 Average Current Consumption
The average current consumption is an important consideration for power-restricted systems, such as battery-operated gas-flow meters.
The current consumption of the device depends on several different parameters, which can be configured using the MSP430 Ultrasonic Design Center GUI. These parameters include the transducer frequency, number of pulses, gap between UPS and DNS, measurement rate (DNS-UPS gap), signal sampling frequency, and capture duration.
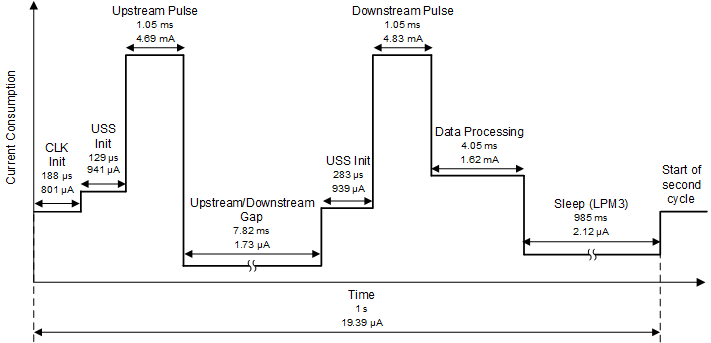
The optimal configuration of these parameters depends on the meter and a trade-off between performance and power consumption exists (see Figure 4-19).
 Figure 4-19 Profile of Current Consumption During Duration of Measurement
The current profile in Figure 4-19 is based on a gas meter pipe and the MSP430FR6043 MCU, with parameters configured as listed in Table 4-5. For brevity, it does not include configuration parameters that have no impact on current consumption.
| Transmit Frequency (kHz) | 170 kHz to 240 kHz |
|---|---|
| Gap Between Pulse Start and ADC Capture (µs) | 200 µs |
| Number of Pulses | 24 |
| UPS and DNS Gap (µs) | 8000 (for 8 ms) |
| UPS0 to UPS1 Gap (ms) | 1000 ms |
| Signal Sampling Frequency (kHz) | 1000 kHz |
| ADC Oversampling Rate | 80 |
| Delta ToF Offset (ps) | 0 |
| Absolute ToF Additional Delay (ns) | 0 |
| Algorithm Option | 2 |
| Envelope Crossing Threshold | 50 |
| Capture Duration (µs) | 250 µs |
| Start PPG Count (ns) | 400000 (for 400 µs) |
| Turn on ADC Count (ns) | 10000 (for 10 µs) |
| Start PGA and IN Bias Count (ns) | 200000 (for 200 µs) |
| USS XTAL Settling Count (µs) | 120 µs |
| External Amplifier Count (ns) | 10000 |
| User Param #8 | 384 |
As shown in Figure 4-19, the instantaneous current consumption varies depending on the state of the software. Table 4-6 describes the states.
| State | Duration | Average Current Consumption | Description Of State |
|---|---|---|---|
| CLK Init | 188 µs | 809 µA | Initialization of USSXT. The USS module is off. |
| USS Init (UPS) | 129 µs | 941 µA | The USS module is on, and registers of all submodules are initialized. |
| Upstream Pulse | 1.05 ms | 4.69 mA | Upstream pulse firing and signal capture |
| Upstream/Downstream Gap | 7.82 ms | 1.73 µA | Gap between UPS and DNS. The CPU is in LPM3. |
| USS Init (DNS) | 283 µs | 939 µA | Prior to DNS firing, the USS module is on, and registers of all submodules are initialized. |
| Downstream Pulse | 1.05 ms | 4.83 mA | DNS pulse firing and signal capture |
| Data Processing | 4.05 µs | 1.62 mA | DToF, AbsToF, and VFR computation. The USS module is off. |
| Sleep | 985 ms | 2.12 µA (1.093 µA) | Gap between the end of a measurement and start of the next measurement. The CPU is in LPM3. The USS module is off. |