JAJU808 July   2021


  1.   概要
  2.   リソース
  3.   特長
  4.   アプリケーション
  5.   5
  6. 1System Description
  7. 2System Overview
    1. 2.1 Block Diagram
    2. 2.2 Design Considerations
      1. 2.2.1  System Control and Processing
      2. 2.2.2  Analog Front End
      3. 2.2.3  Input Voltage Monitoring: 5 V, 20 V, 40 V, and ±5 V
      4. 2.2.4  Bidirectional Current Sense: ±2 A
      5. 2.2.5  Unipolar Current Sense: 0.25 A to 1 A
      6. 2.2.6  TMP461-SP: Local and Remote Temperature Sensing
      7. 2.2.7  NTC Thermistor Temperature Sensing
      8. 2.2.8  Adjustable Voltage Source
      9. 2.2.9  Fixed Output Current Source
      10. 2.2.10 Adjustable 4-mA Current Source
      11. 2.2.11 Power Tree and Power Sequencing
    3. 2.3 Highlighted Products
      1. 2.3.1  MSP430FR5969-SP
      2. 2.3.2  ADC128S102QML-SP
      3. 2.3.3  DAC121S101QML-SP
      4. 2.3.4  LMP7704-SP
      5. 2.3.5  INA901-SP
      6. 2.3.6  LM4050QML-SP
      7. 2.3.7  LM158QML-SP
      8. 2.3.8  LM139QML-SP
      9. 2.3.9  TMP461-SP
      10. 2.3.10 TPS7A4501-SP
      11. 2.3.11 TPS7H2201-SP
  8. 3Hardware, Software, Testing Requirements, and Test Results
    1. 3.1 Required Hardware and Software
      1. 3.1.1 Hardware
      2. 3.1.2 Software
    2. 3.2 Test Setup
      1. 3.2.1 Voltage Monitor Test Setup
      2. 3.2.2 Current Monitor Test Setup
    3. 3.3 Test Results
      1. 3.3.1 Voltage Measurement - Noise Floor Results
      2. 3.3.2 Voltage Measurement - Linearity Results
      3. 3.3.3 Current Measurement - Noise Floor Results
      4. 3.3.4 Current Measurement - Linearity Results
      5. 3.3.5 Analog Outputs
  9. 4Design and Documentation Support
    1. 4.1 Design Files
      1. 4.1.1 Schematics
      2. 4.1.2 BOM
    2. 4.2 Documentation Support
    3. 4.3 サポート・リソース
    4. 4.4 Trademarks
  10. 5About the Author

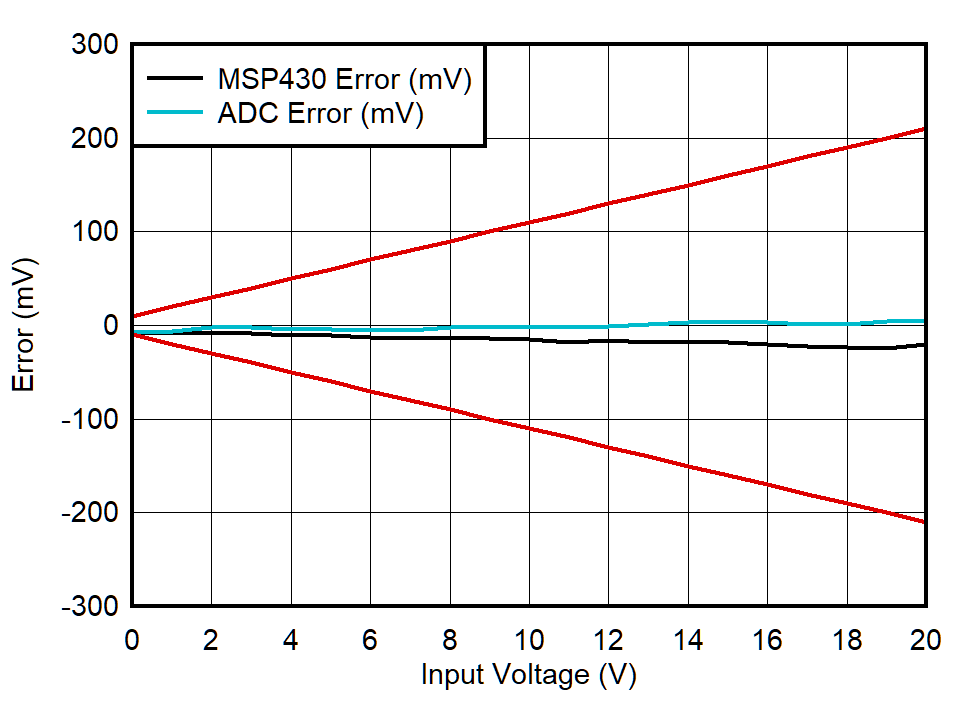
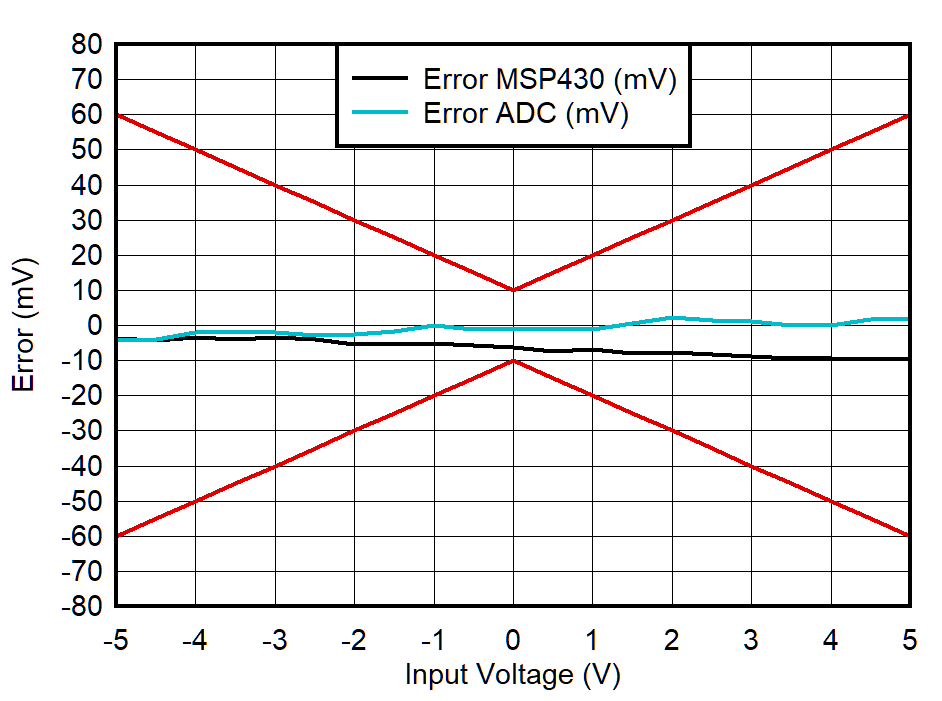
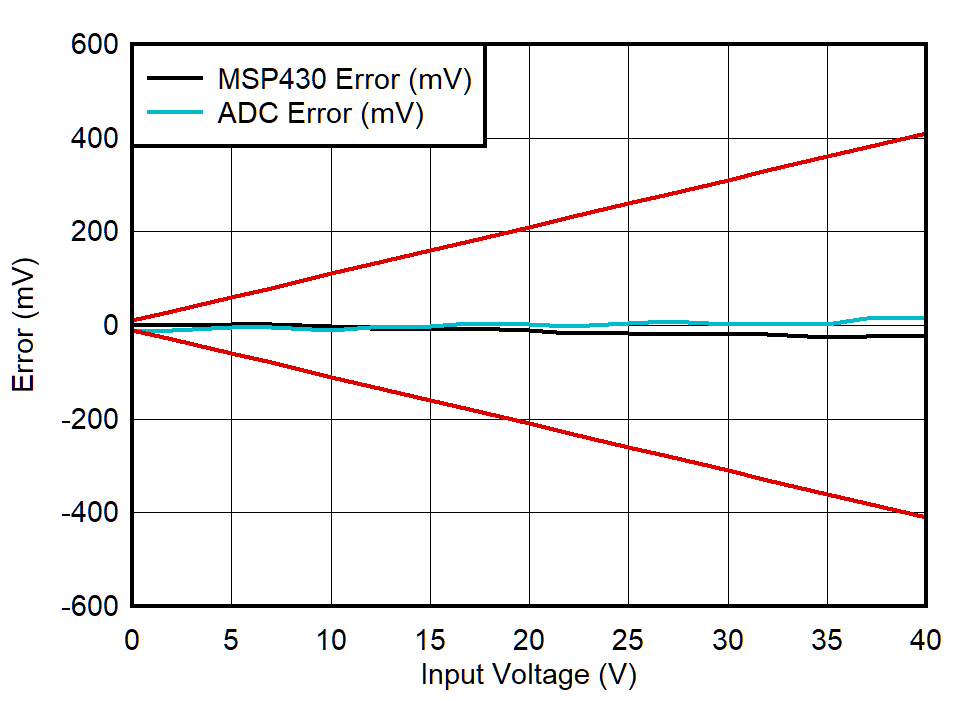
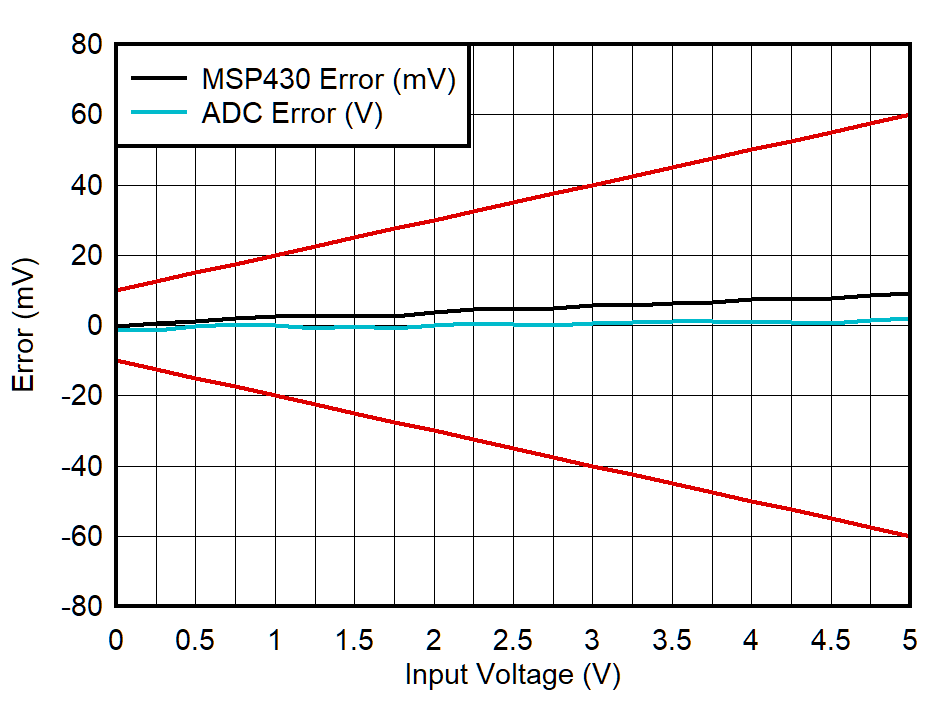
Voltage Measurement - Linearity Results

GUID-20210415-CA0I-BD9N-0CHZ-JKFB22ZBNRD2-low.pngFigure 3-8 Linearity Plot (5-V Range)
GUID-20210415-CA0I-QJKK-TRZM-9XHHMH675NP3-low.pngFigure 3-10 Linearity Plot (20-V Range)
GUID-20210415-CA0I-MN1D-3D3K-M6KMJKJ4RMHS-low.pngFigure 3-9 Linearity Plot (±5-V Range)
GUID-20210415-CA0I-FRCV-HHFM-DQV5MXCSJB30-low.pngFigure 3-11 Linearity Plot (40-V Range)