SBOA444 November 2020 TMCS1100
5.2 Results
This section provides details of the test results.
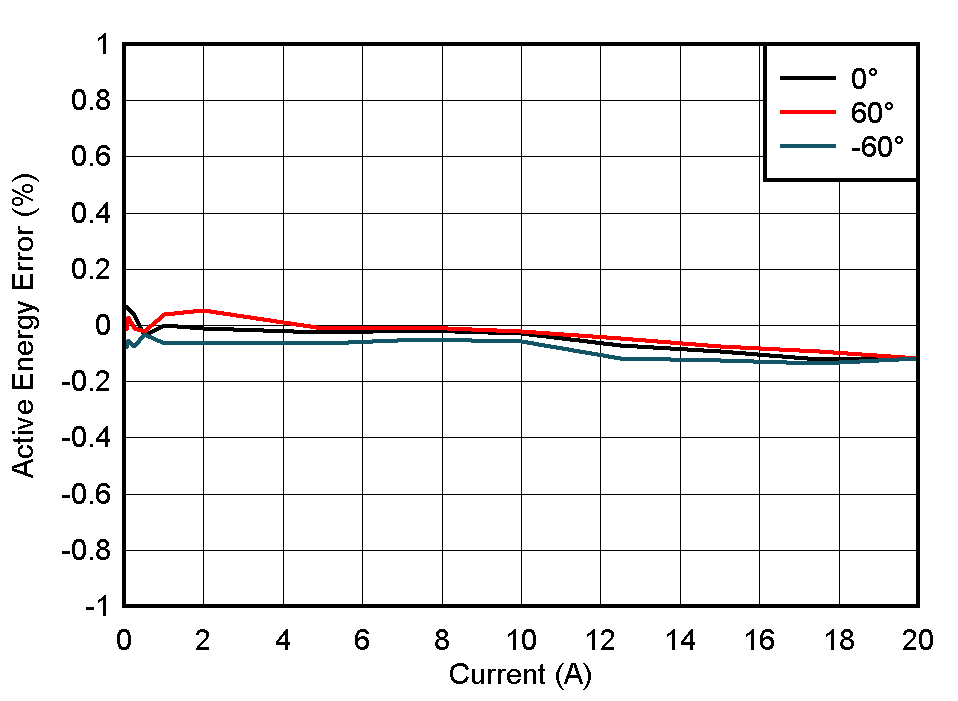
Table 5-1 Voltage-Current A Mapping
Active Energy % Error vs Current
| CURRENT (A) | 0° | 60° | –60° |
|---|---|---|---|
| 0.05 | 0.066 | 0.016 | –0.079 |
| 0.1 | 0.062 | 0.03 | –0.054 |
| 0.25 | 0.036 | –0.009 | –0.074 |
| 0.5 | –0.036 | –0.023 | 0.033 |
| 1 | –0.0003 | 0.04 | –0.0637 |
| 2 | –0.0105 | 0.052 | –0.059 |
| 5 | –0.0263 | –0.011 | –0.064 |
| 7.5 | –0.017 | –0.007 | –0.05 |
| 10 | –0.0273 | –0.022 | –0.056 |
| 12.5 | –0.072 | –0.048 | –0.118 |
| 15 | –0.0923 | –0.075 | –0.124 |
| 17.5 | –0.121 | –0.094 | –0.136 |
| 20 | –0.12 | –0.117 | –0.117 |
 Figure 5-1 Voltage-Current A Mapping Active Energy % Error vs Current
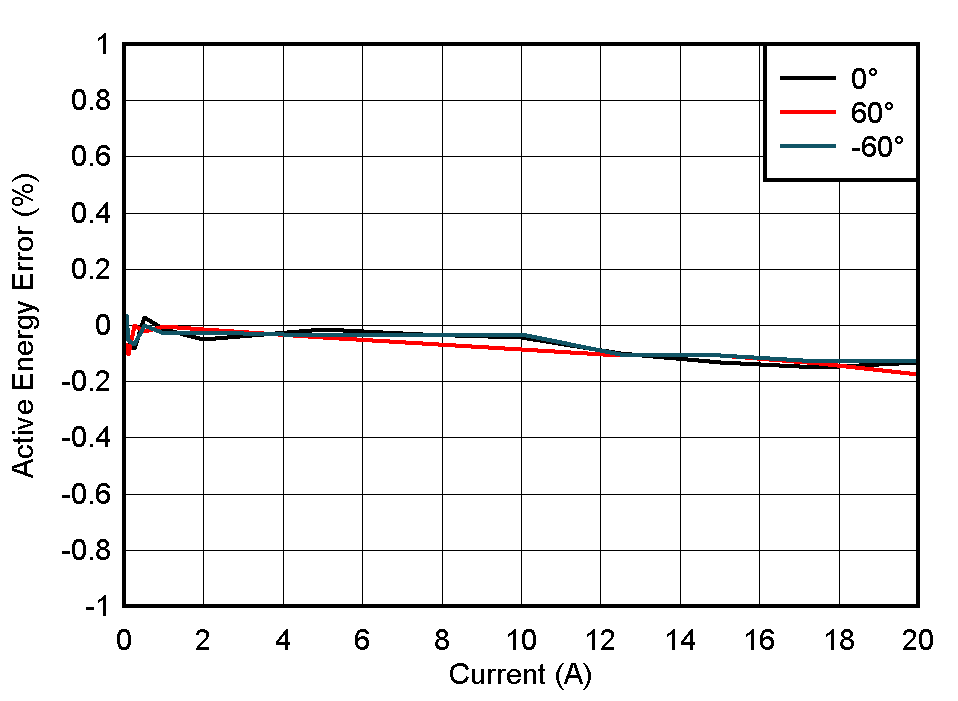
Table 5-2 Voltage-Current B Mapping Active Energy % Error vs Current
| CURRENT (A) | 0° | 60° | –60° |
|---|---|---|---|
| 0.05 | –0.095 | –0.067 | 0.037 |
| 0.1 | –0.066 | –0.102 | –0.054 |
| 0.25 | –0.083 | 0 | –0.068 |
| 0.5 | 0.028 | –0.023 | –0.001 |
| 1 | –0.013 | –0.003 | –0.03 |
| 2 | –0.049 | –0.014 | –0.026 |
| 5 | –0.014 | –0.044 | –0.035 |
| 7.5 | –0.033 | –0.064 | –0.037 |
| 10 | –0.043 | –0.084 | –0.031 |
| 12.5 | –0.1 | –0.107 | –0.103 |
| 15 | –0.133 | –0.107 | –0.108 |
| 17.5 | –0.151 | –0.137 | –0.129 |
| 20 | –0.13 | –0.173 | –0.125 |
 Figure 5-2 Voltage-Current B Mapping Active Energy % Error vs Current
Table 5-3 Voltage-Current C Mapping Active Energy % Error vs Current
| CURRENT (A) | 0° | 60° | –60° |
|---|---|---|---|
| 0.05 | 0.061 | 0.049 | 0.112 |
| 0.1 | –0.02 | 0.139 | –0.062 |
| 0.25 | –0.024 | 0.058 | 0.111 |
| 0.5 | –0.03 | 0.039 | –0.065 |
| 1 | –0.016 | –0.022 | 0 |
| 2 | –0.0243 | 0.027 | –0.08 |
| 5 | –0.0257 | 0.032 | –0.035 |
| 7.5 | –0.022 | –0.01 | –0.067 |
| 10 | –0.0623 | 0.011 | –0.062 |
| 12.5 | –0.0823 | –0.023 | –0.155 |
| 15 | –0.1 | –0.057 | –0.135 |
| 17.5 | –0.153 | –0.11 | –0.151 |
| 20 | –0.153 | –0.127 | –0.207 |
 Figure 5-3 Voltage-Current C Mapping Active Energy % Error vs Current
Table 5-4 RMS Current A % Error
| CURRENT (A) | GUI CURRENT READING (A) | REFERENCE METER READING (A) | % ERROR |
|---|---|---|---|
| 0.1 | 0.101219 | 0.10005 | 1.1684 |
| 0.25 | 0.25053 | 0.25001 | 0.2080 |
| 0.5 | 0.5002 | 0.50002 | 0.0360 |
| 1 | 1.00053 | 1.0001 | 0.0430 |
| 2 | 2.0008 | 2.0001 | 0.0350 |
| 5 | 4.99939 | 4.9996 | –0.0042 |
| 7.5 | 7.501 | 7.4991 | 0.0253 |
| 10 | 9.99727 | 10.001 | –0.0373 |
| 12.5 | 12.5031 | 12.507 | –0.0312 |
| 15 | 14.9977 | 15.003 | –0.0353 |
| 17.5 | 17.4938 | 17.501 | –0.0411 |
| 20 | 19.9816 | 20 | –0.0920 |
 Figure 5-4 RMS Current A % Error
Table 5-5 RMS Current B % Error
| CURRENT (A) | GUI CURRENT READING (A) | REFERENCE METER READING (A) | % ERROR |
|---|---|---|---|
| 0.1 | 0.10118 | 0.099974 | 1.2063 |
| 0.25 | 0.250601 | 0.24996 | 0.2564 |
| 0.5 | 0.500613 | 0.4999 | 0.1426 |
| 1 | 1.00036 | 1.0001 | 0.0260 |
| 2 | 2.00081 | 2.002 | –0.0594 |
| 5 | 5.00075 | 4.9988 | 0.0390 |
| 7.5 | 7.49846 | 7.4982 | 0.0035 |
| 10 | 9.99771 | 9.9977 | 0.0001 |
| 12.5 | 12.4902 | 12.504 | –0.1104 |
| 15 | 14.9914 | 15 | –0.0573 |
| 17.5 | 17.483 | 17.502 | –0.1086 |
| 20 | 19.9802 | 20.002 | –0.1090 |
 Figure 5-5 RMS
Current B % Error
Table 5-6 RMS Current C % Error
| CURRENT (A) | GUI CURRENT READING (A) | REFERENCE METER READING (A) | % ERROR |
|---|---|---|---|
| 0.1 | 0.101275 | 0.1 | 1.2750 |
| 0.25 | 0.25027 | 0.24996 | 0.1240 |
| 0.5 | 0.499771 | 0.4999 | –0.0258 |
| 1 | 0.999515 | 0.99991 | –0.0395 |
| 2 | 1.99821 | 2 | –0.0895 |
| 5 | 4.99569 | 4.9989 | –0.0642 |
| 7.5 | 7.49579 | 7.4988 | –0.0401 |
| 10 | 9.98942 | 10 | –0.0938 |
| 12.5 | 12.4857 | 12.504 | –0.1464 |
| 15 | 14.9768 | 15 | –0.1547 |
| 17.5 | 17.4664 | 17.499 | –0.1863 |
| 20 | 19.9472 | 19.999 | –0.2590 |
 Figure 5-6 RMS Current C % Error
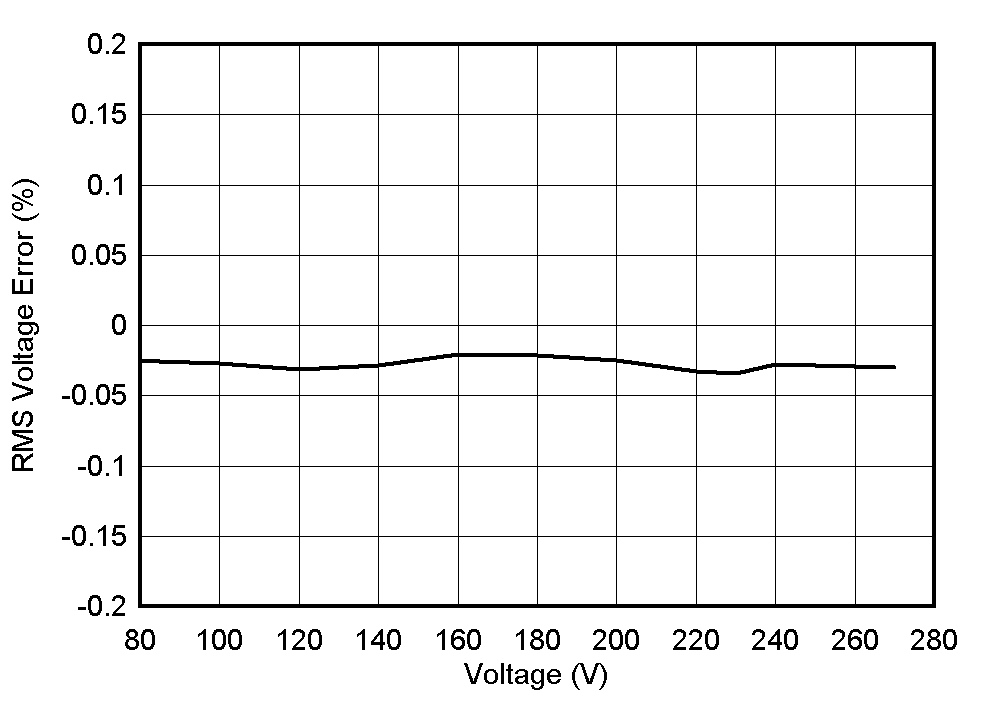
Table 5-7 RMS Voltage % Error
| VOLTAGE (V) | GUI VOLTAGE READING (V) | REFERENCE METER READING (V) | % ERROR |
|---|---|---|---|
| 9 | 9.001 | 9.005 | –0.0444 |
| 10 | 10 | 10.004 | –0.0400 |
| 30 | 29.996 | 30.003 | –0.0233 |
| 50 | 49.991 | 50.004 | –0.0260 |
| 70 | 69.995 | 70.012 | –0.0243 |
| 100 | 99.983 | 100.01 | –0.0270 |
| 120 | 119.982 | 120.02 | –0.0317 |
| 140 | 139.99 | 140.03 | –0.0286 |
| 160 | 159.977 | 160.01 | –0.0206 |
| 180 | 179.992 | 180.03 | –0.0211 |
| 200 | 199.98 | 200.03 | –0.0250 |
| 220 | 219.978 | 220.05 | –0.0327 |
| 230 | 229.971 | 230.05 | –0.0343 |
| 240 | 239.993 | 240.06 | –0.0279 |
| 270 | 270 | 270.08 | –0.0296 |
 Figure 5-7 RMS Voltage % Error
Table 5-8 Voltage-Current A Mapping Active Power % Error vs Current, 0° Phase Shift
| CURRENT (A) | GUI ACTIVE POWER READING (W) | REFERENCE METER READING (W) | % ERROR |
|---|---|---|---|
| 0.1 | 23.046 | 23.016 | 0.1303 |
| 0.25 | 57.489 | 57.515 | –0.0452 |
| 0.5 | 115.053 | 115.02 | 0.0287 |
| 1 | 230.021 | 230.07 | –0.0213 |
| 2 | 460.111 | 460.12 | –0.0020 |
| 5 | 1149.75 | 1150.2 | –0.0391 |
| 7.5 | 1725.35 | 1725.2 | 0.0087 |
| 10 | 2299.41 | 2300.7 | –0.0561 |
| 12.5 | 2875.52 | 2877 | –0.0514 |
| 15 | 3449.55 | 3451.8 | –0.0652 |
| 17.5 | 4021.51 | 4026.2 | –0.1165 |
| 20 | 4596 | 4601 | –0.1087 |
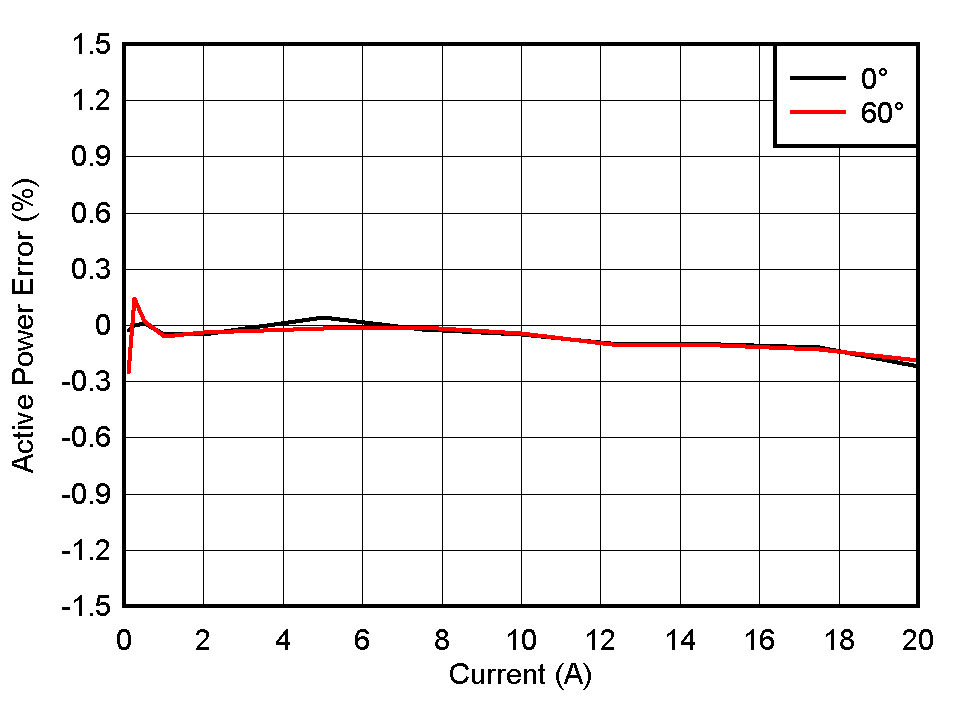
Table 5-9 Voltage-Current A Mapping Active Power % Error vs Current, 60° Voltage-Current B Mapping Active Power % Error vs Current, 0° Phase Shift
| CURRENT (A) | GUI ACTIVE POWER READING (W) | REFERENCE METER READING (W) | % ERROR |
|---|---|---|---|
| 0.1 | 11.46 | 11.504 | –0.3825 |
| 0.25 | 28.783 | 28.744 | 0.1357 |
| 0.5 | 57.539 | 57.491 | 0.0835 |
| 1 | 115.137 | 115.05 | 0.0756 |
| 2 | 230.057 | 229.95 | 0.0465 |
| 5 | 574.89 | 574.84 | 0.0087 |
| 7.5 | 862.212 | 862.39 | –0.0206 |
| 10 | 1150.5 | 1150.3 | 0.0174 |
| 12.5 | 1436.45 | 1437.7 | –0.0869 |
| 15 | 1724.55 | 1725 | –0.0261 |
| 17.5 | 2010.12 | 2012 | –0.0934 |
| 20 | 2297.69 | 2299.4 | –0.0744 |
 Figure 5-8 Voltage-Current A Mapping Active Power % Error vs Current 90
Table 5-10 Voltage-Current B Mapping Active Power % Error vs Current, 0° Phase Shift
| CURRENT (A) | GUI ACTIVE POWER READING (W) | REFERENCE METER READING (W) | % ERROR |
|---|---|---|---|
| 0.1 | 23.023 | 23.002 | 0.0913 |
| 0.25 | 57.48 | 57.501 | –0.0365 |
| 0.5 | 115.07 | 114.99 | 0.0696 |
| 1 | 230.017 | 229.99 | 0.0117 |
| 2 | 460.1928 | 460 | 0.0419 |
| 5 | 1149.66 | 1149.8 | –0.0122 |
| 7.5 | 1724.5 | 1725 | –0.0290 |
| 10 | 2299.43 | 2299.9 | –0.0204 |
| 12.5 | 2873.59 | 2875.1 | –0.0525 |
| 15 | 3446.3 | 3450.6 | –0.1246 |
| 17.5 | 4020.2 | 4026.5 | –0.1565 |
| 20 | 4595 | 4600 | –0.1087 |
Table 5-11 Voltage-Current B Mapping Active Power % Error vs Current, 60° Phase Shift
| CURRENT (A) | GUI ACTIVE POWER READING (W) | REFERENCE METER READING (W) | % ERROR |
|---|---|---|---|
| 0.1 | 11.547 | 11.501 | 0.4000 |
| 0.25 | 28.76 | 28.745 | 0.0522 |
| 0.5 | 57.594 | 57.501 | 0.1617 |
| 1 | 114.998 | 115.01 | –0.0104 |
| 2 | 230.049 | 229.94 | 0.0474 |
| 5 | 574.649 | 574.99 | –0.0593 |
| 7.5 | 862.059 | 862.46 | –0.0465 |
| 10 | 1149.61 | 1150 | –0.0339 |
| 12.5 | 1435.72 | 1436.9 | –0.0821 |
| 15 | 1722 | 1724.2 | –0.1276 |
| 17.5 | 2008.68 | 2010.9 | –0.1104 |
| 20 | 2295.41 | 2299.2 | –0.1648 |
 Figure 5-9 Voltage-Current B Mapping Active Power % Error vs Current
Table 5-12 Voltage-Current C Mapping Active Power % Error vs Current,0° Phase Shift
| CURRENT (A) | GUI ACTIVE POWER READING (W) | REFERENCE METER READING (W) | % ERROR |
|---|---|---|---|
| 0.1 | 22.999 | 23.005 | –0.0261 |
| 0.25 | 57.5 | 57.499 | 0.0017 |
| 0.5 | 115 | 114.99 | 0.0087 |
| 1 | 229.914 | 230.02 | –0.0461 |
| 2 | 459.885 | 460.1 | –0.0467 |
| 5 | 1150 | 1149.52 | 0.0418 |
| 7.5 | 1724.74 | 1725.1 | –0.0209 |
| 10 | 2299.2 | 2300.3 | –0.0478 |
| 12.5 | 2873.22 | 2876.2 | –0.1036 |
| 15 | 3447.22 | 3450.8 | –0.1037 |
| 17.5 | 4020.78 | 4025.5 | –0.1173 |
| 20 | 4590.42 | 4600.4 | –0.2169 |
Table 5-13 Voltage-Current C Mapping Active Power % Error vs Current, 60° Phase Shift
| CURRENT (A) | GUI ACTIVE POWER READING (W) | REFERENCE METER READING (W) | % ERROR |
|---|---|---|---|
| 0.1 | 11.469 | 11.498 | –0.2522 |
| 0.25 | 28.729 | 28.687 | 0.1464 |
| 0.5 | 57.47 | 57.458 | 0.0209 |
| 1 | 114.922 | 114.99 | –0.0591 |
| 2 | 229.8 | 229.885 | –0.0370 |
| 5 | 574.507 | 574.61 | –0.0179 |
| 7.5 | 862.051 | 862.14 | –0.0103 |
| 10 | 1149.32 | 1149.8 | –0.0417 |
| 12.5 | 1434.67 | 1436.2 | –0.1065 |
| 15 | 1721.22 | 1723.1 | –0.1091 |
| 17.5 | 2007.75 | 2010.3 | –0.1268 |
| 20 | 2292.83 | 2297.1 | –0.1859 |
 Figure 5-10 Voltage-Current C Mapping Active Power % Error vs Current