SBOA597 November 2024 OPA928
3.1 Point to Point Wiring
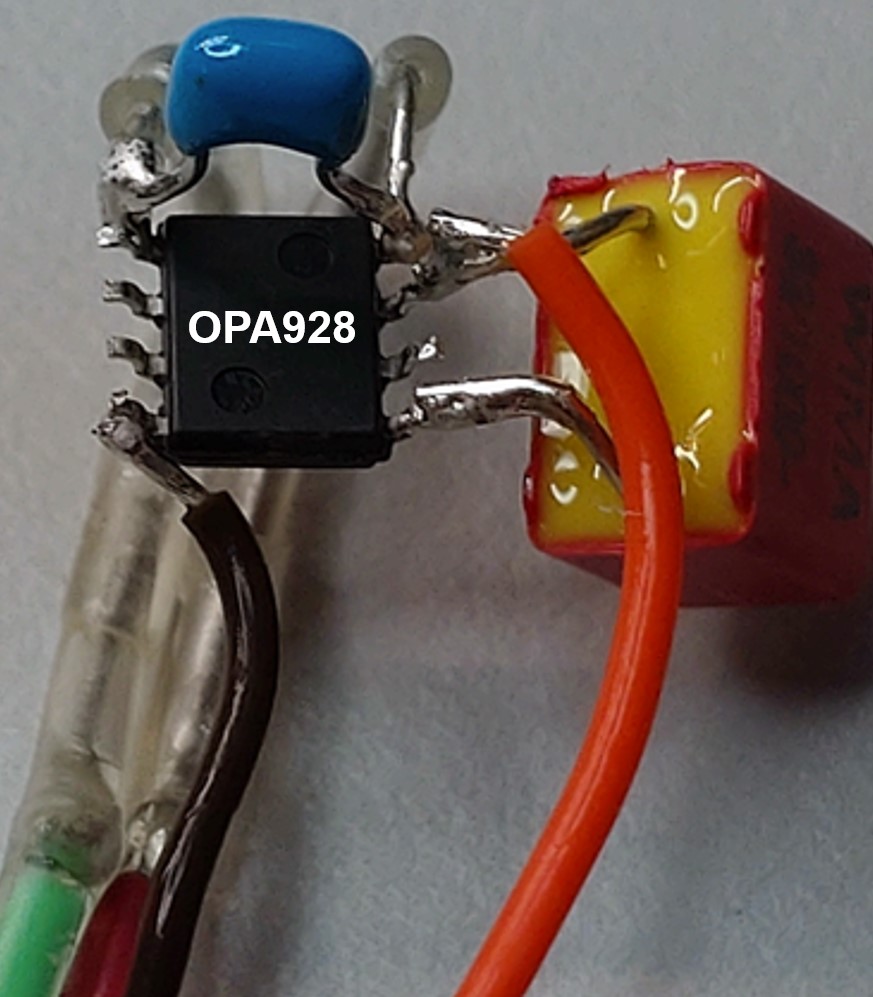
The following test configuration was built to examine how much resolution of IB can be obtained under the designed for measurement condition. As shown in Figure 3-1, a point-to-point wired self-integration circuit consists of a minimum number of parts, such as a decoupling capacitor and an integration capacitor. The only major leakage path is the integration capacitor. As air is one of the most insulated materials, we rely on it to obtain benchmark data.
 Figure 3-1 OPA928 SOIC Point-to-Point Wiring
 Figure 3-2 Schematic of the Point-to-Point Wiring
As seen in the previous section, the input bias current model is a DC flow into the capacitor. Therefore, the voltage change across the capacitor over time indicates the amount of IB. When multiplied by the capacitance, the result is current in Ampere.
The data acquisition rate is 6SPS for 100 samples and calculates a slope of Vout over time, dV/dt. Multiply by the integration capacitor 31.7pF, and IB is plotted as shown below. The average number is 0.387fA to 0.397fA for the entire measurement of three days.
 Figure 3-3 Course Measurement of IB Over Time With Point-to-Point Wiring
As mentioned previously, one of the advantages of the coulomb meter is that the meter averages the current flow over time; the longer the integration time, lower the noise and higher measurement resolution.
Looking at the data plotted versus time can help understanding what inaccuracies can occur in the coulombmeter circuit. The measurement shown in Figure 3-4 shows the effects of the initial condition on the circuit. Each data point is a localized derivative, with the graph starting at –0.8V. The derivative of the curve changes in the first few hours. The data starts at 395aA and eventually goes up to 400aA.
 Figure 3-4 Fine Measurement of IB Over Time With Point-to-Point Wiring
The fitting curve of measured current versus voltage (voltage across the capacitor) provides resistance of the integration capacitor in 649PΩ. The lowest amount of leakage occurs when the output voltage crosses zero volts because the voltage across the capacitor is close to zero. The current measured at the curve crossing zero volts indicates the least leakage across the capacitor, and the value is 395aA. Benchmarking data provides IB data with a resolution of tens of atto-Amperes.
 Figure 3-5 Course IB Over Vout With Point-to-Point Wiring
Benchmarking data provides IB data with a resolution of tens of atto-Amperes.