SLAAEE3A July 2023 – June 2024 MSPM0L1306
4.2 Step2: Get the Battery Model
Get the battery model from the pulse discharge test case. It is always good to get the battery model for your project. However, for MSPM0 Gauge L1 with low discharge current in real application, you do not really need to do the test. Reuse the default model in the code or get a model related to your battery chemistry from the Web. For higher-level MSPM0 Gauge solution, as the accuracy lies on the battery model, obtain the dedicated battery model.
Use any machine that can charge and discharge the battery for the test machine, and record the tested data. The paired test machine with the supplied GUI is Keithley 2602A source meter, which is controlled through a USB to rs232 wire, paired with NI_VISA.
To get a more accurate model, discharge the battery with low current, like 0.1C for 20 minutes. The rest time after each pulse is about 1–2 hours, then you can take the Vcell as OCV. Finally, with this setting about 30 points are obtained.
Table 4-1 shows a suggested test pattern.
| Parameter | Value | Comment |
|---|---|---|
| Start voltage (OCV) | 4.3~4.4 V | Make sure the start voltage is no lower than the application max charge voltage |
| End voltage (OCV) | 2.5~3.0 V | Make sure the rest voltage (OCV) is no higher than the application min discharge voltage |
| Discharge current | 0.05C ~ 0.1C | Low current means more point |
| Discharge time | 20 minutes | Low discharge time means more point |
| Rest time | 1-2 hours | Longer is better |
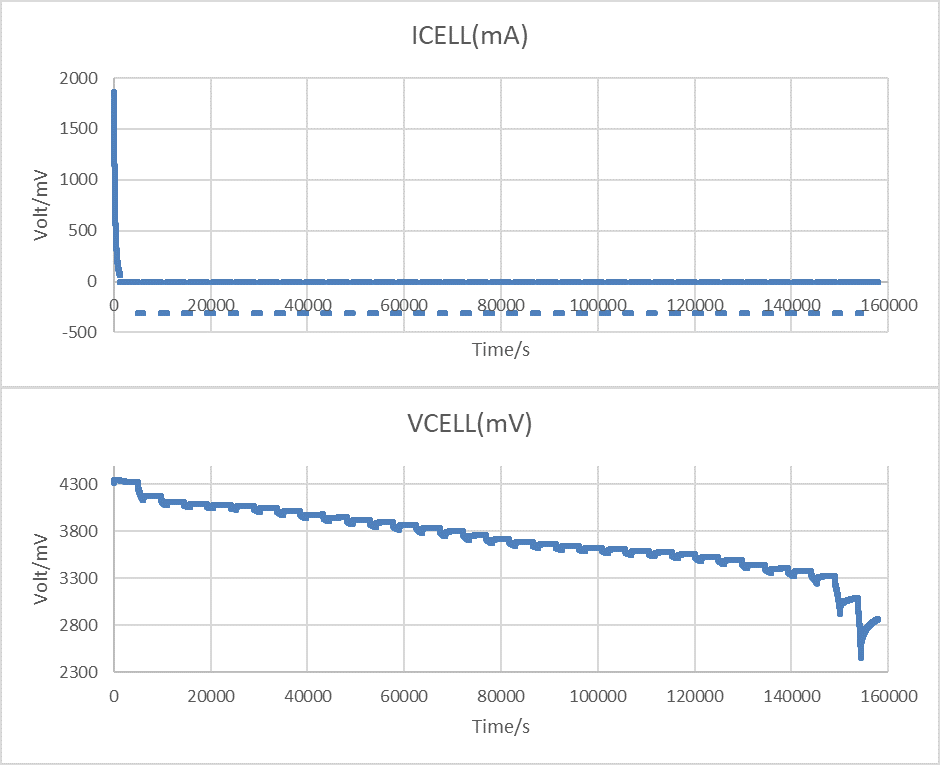
Figure 4-1 shows a battery model example test case. In this example, the battery is fully charged (4350 mV) and rests for 1 hour, with the voltage drops to 4322 mV. Then, it does a pulse discharge and rests to get the OCV under different SoC. The test is terminated at 2450 mV. After 1-hour rest, the voltage increases to 2864 mV. So, the OCV range of the SoC-OCV table is from 2864mV to 4322 mV. The start voltage is 4322 mV and the end voltage is 2864 mV under the difference between the OCV and battery voltage.
 Figure 4-1 Pulse Discharge Test Case
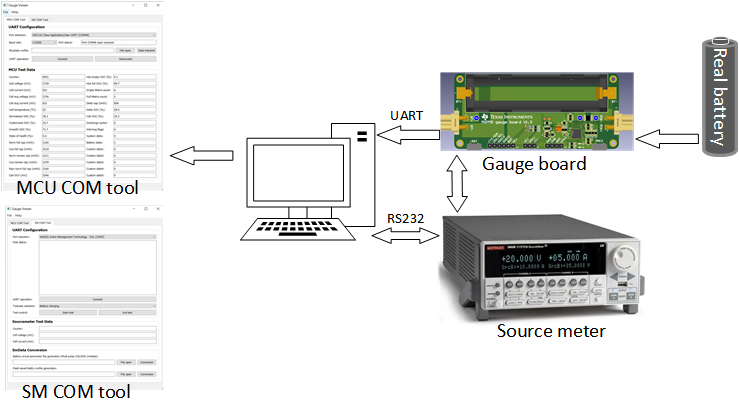
The suggested setup is shown as below. MCU COM tool is used to get the battery run data. SM COM tool is used to control the source meter to generate pulse battery charge and collect the voltage and current data to generate the battery parameters later.
Pay attention to connect source meter in four wire mode, which can reduce the voltage detection error caused from line resistance. Test the battery under real application board, because the application board influences the battery parameters as well, especially the battery resistor.
 Figure 4-2 Hardware Structure to Get Battery Model
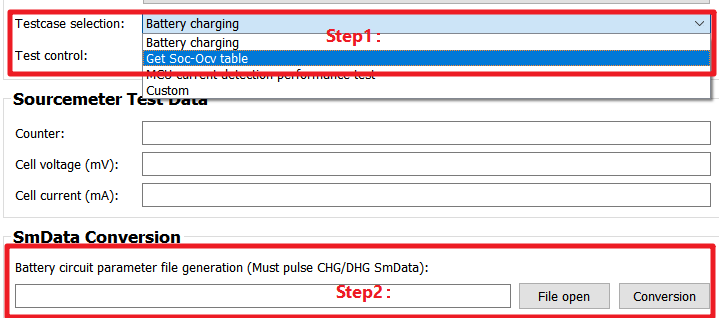
Remember to change the parameters in the Python source code, like the discharge current, end voltage and so on, according to your application. After you get battery running data, you can then use “Battery circuit parameter file generation” to get the battery circuit file in Excel and text, shown in Figure 4-3. The input file can be SMData and MCUData.
 Figure 4-3 Battery Circuit Table Generation
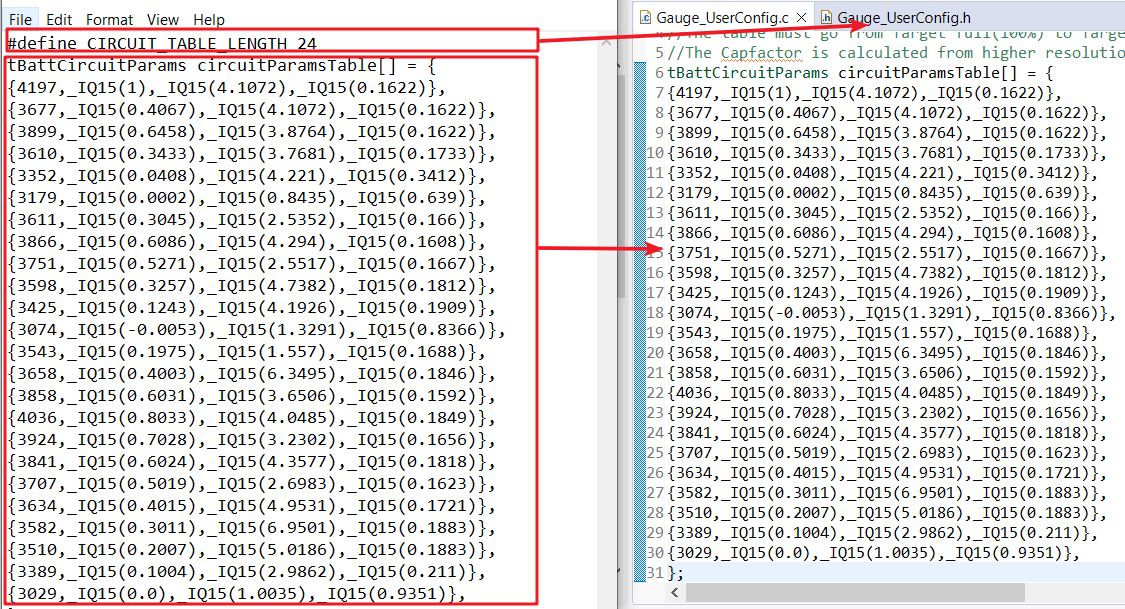
Copy the generated table in the text into Gauge_UserConfig.c, and the table length into Gauge_UserConfig.h. Then you can finish the battery circuit table input. The cap factor equals to dSoc(%)/dOcv(mV)*Qmax(As) or dSoc(%)/dOcv(V)*3.6*Qmax(mAh). For other parameters generation method, see the Python source code.
 Figure 4-4 Battery Circuit Table Input
Attention: For MSPM0 Gauge L1, it calculates a static SoC, which does not take the residual SoC or battery aging into consideration. That means you need to add some buffer by setting the minimum OCV of SoC-OCV table higher than application min discharge voltage. Table 4-2 shows an example for the suggested minimum OCV for different discharge conditions.
| Current < 0.01C | Current < 0.1C | Current < 0.5C | |
|---|---|---|---|
| Table max OCV | 4.2 V | 4.2 V | 4.2 V |
| Table min OCV | 3 V | 3.2 V | 3.4 V |
| Application max charge voltage | 4.2 V | 4.2 V | 4.2 V |
| Application min discharge voltage | 2.8 V | 2.8 V | 2.8 V |
For high-level MSPM0 Gauge solution, as it takes the residual SoC or battery aging into consideration, make the circuit table larger than the application voltage range to reserve some buffer. Table 4-3 shows an example for different discharge conditions.
| Current < 0.01C | Current < 0.1C | Current < 0.5C | |
|---|---|---|---|
| Table max OCV | 4.3 V | 4.3 V | 4.3 V |
| Table min OCV | 2.6 V | 2.6 V | 2.6 V |
| Application max charge voltage | 4.2 V | 4.2 V | 4.2 V |
| Application min discharge voltage | 2.8 V | 2.8 V | 2.8 V |