SLUUB60B May 2015 – August 2021 TPS544B25 , TPS544C25
- Trademarks
- 1 Introduction
- 2 Description
- 3 EVM Electrical Performance Specifications
- 4 Schematic
- 5 Test Setup
- 6 EVM Configuration Using the Fusion GUI
- 7 Test Procedure
- 8 Performance Data and Typical Characteristic Curves
- 9 Fusion GUI
- 10EVM Assembly Drawing and PCB Layout
- 11List of Materials
- 12Revision History
9 Fusion GUI
 Figure 9-1 First Window at Fusion Launch
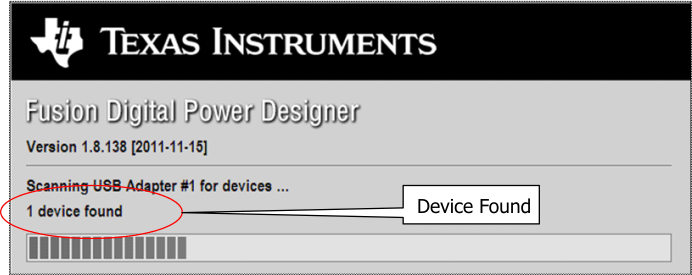 Figure 9-2 Scan Finds Device Successfully
 Figure 9-3 Software Launch Continued
 Figure 9-4 Software Launch Continued
Use this next screen to configure (Figure 9-5):
- OV and UV Fault and Warn Limit
- OC Fault and OC Warn Limit
- OT Fault and OT Warn Limit
- Fault Response
- UVLO
- On/Off Configuration
- Sequencing
- VOUT Command Voltage
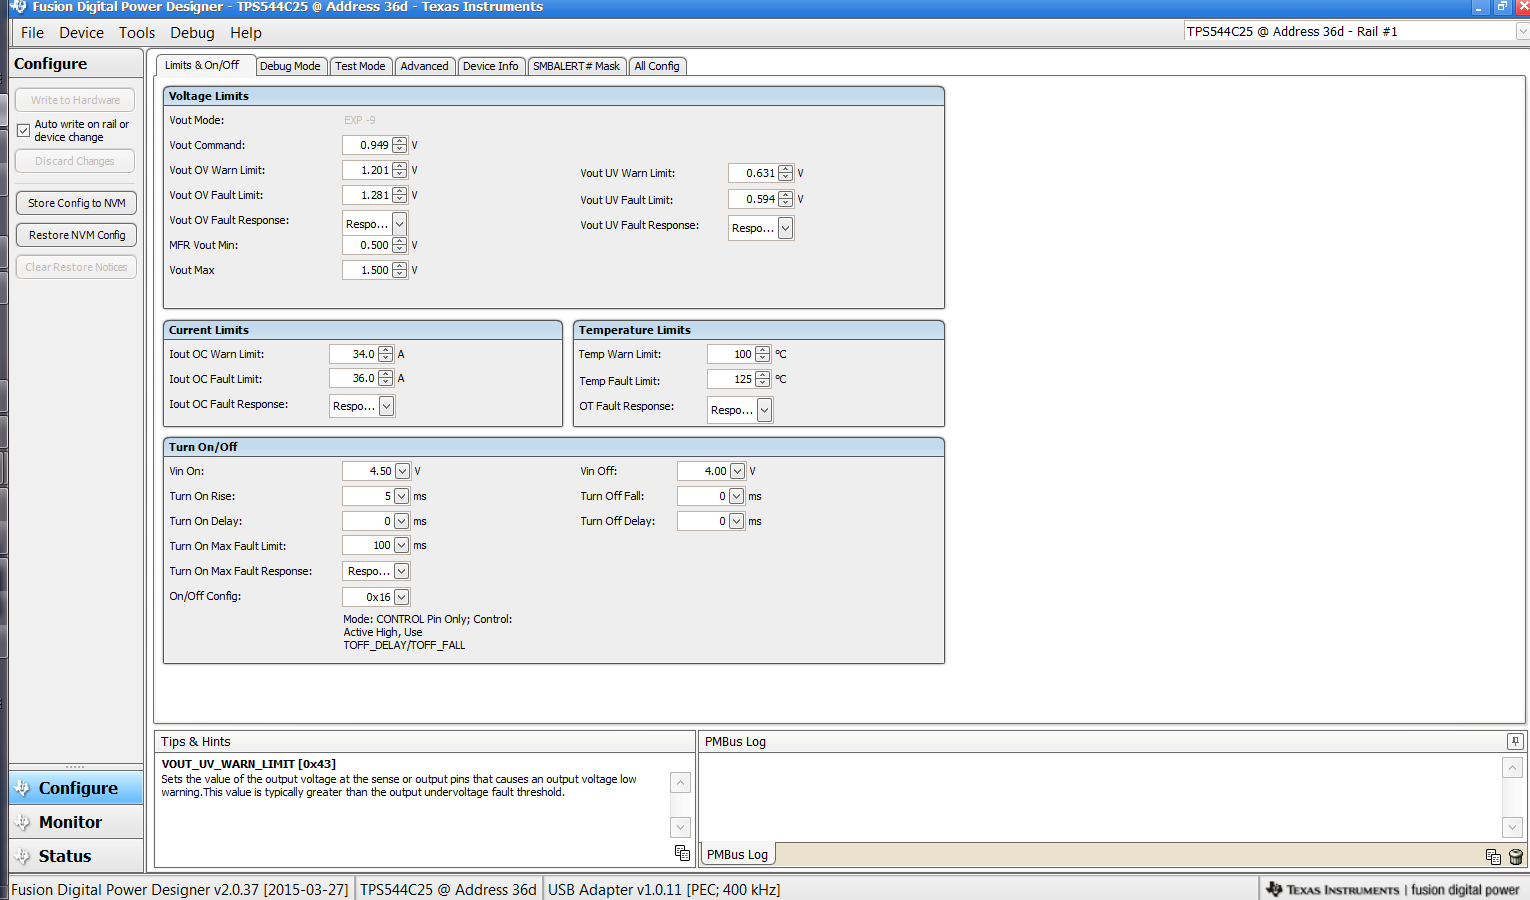 Figure 9-5 First Screen After Successful Launch Configure: Limits and On/Off
Changing the on/off configuration prompts a pop-up window with details of the options Figure 9-6).
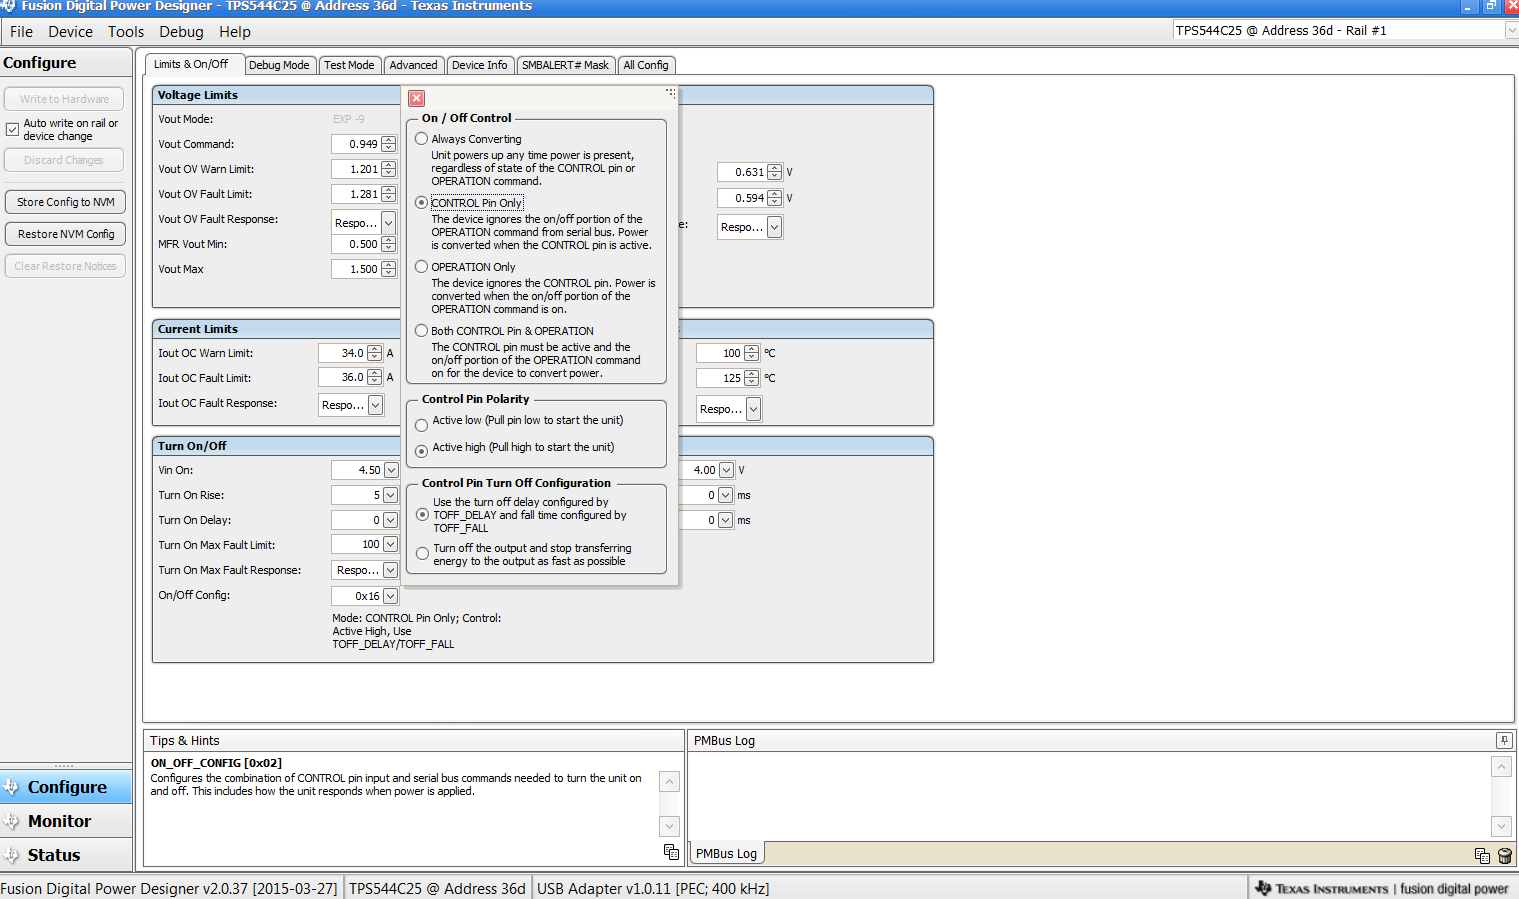 Figure 9-6 Configure: Limits and On/Off- On/Off Configuration Pop-up
After a change is selected, orange U icon is displayed to offer Undo Change option. Change is not retained until either Write to Hardware or Store Config to NVM is selected. When Write to Hardware is selected, change is committed to volatile memory and defaults back to previous setting on input power cycle. When Store Config to NVM is selected, change is committed to nonvolatile memory and becomes the new default (Figure 9-7).
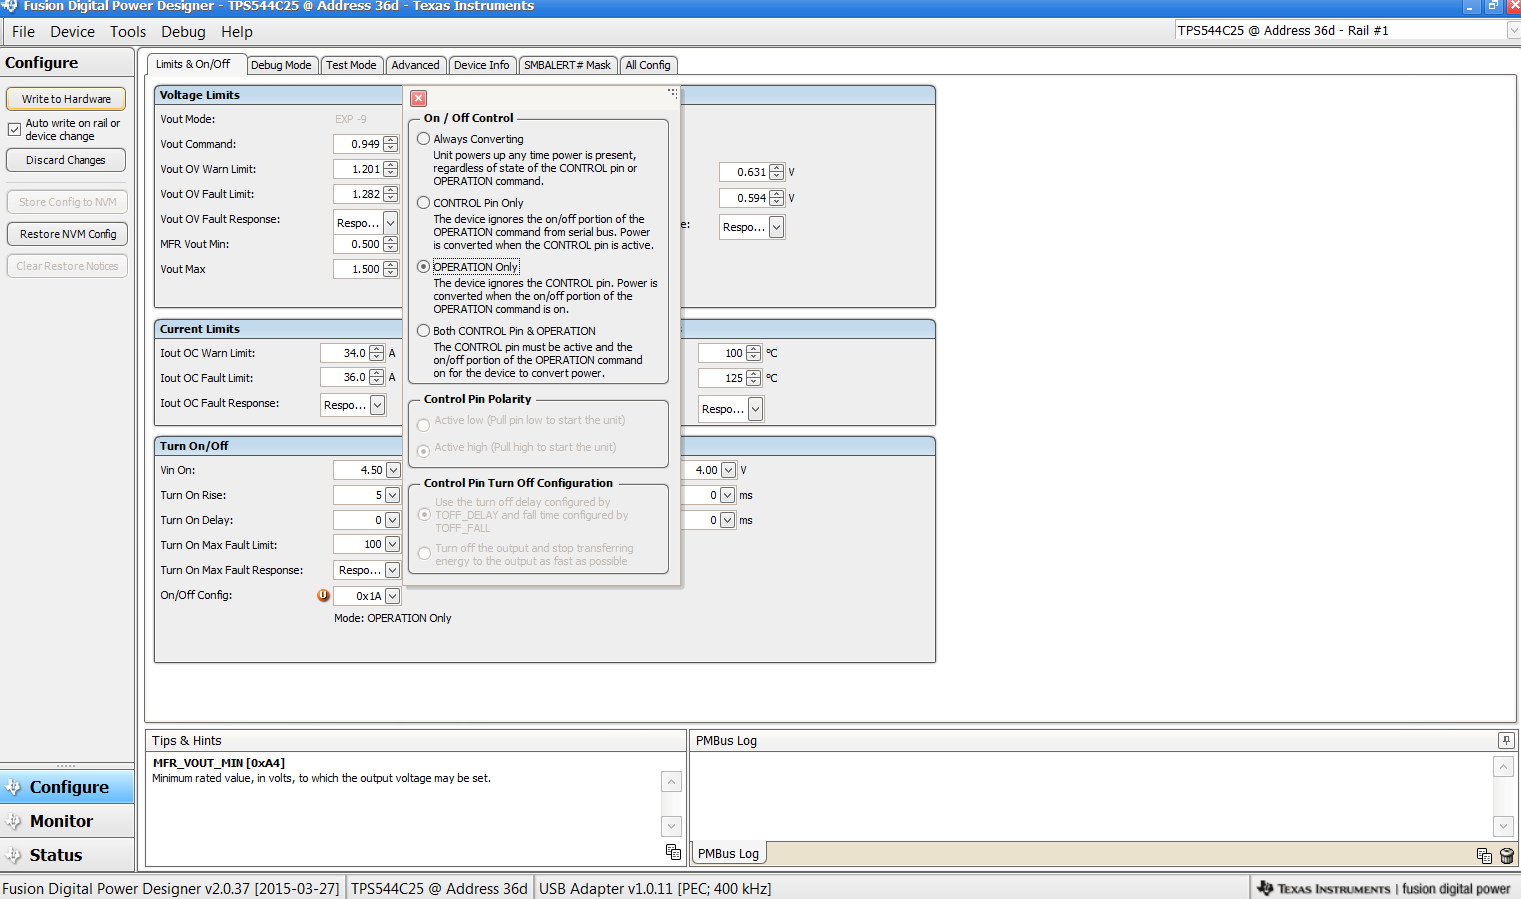 Figure 9-7 Configure: Limits and On/Off- On/Off Config Pop-Up with Change
Use "Advanced" tag to configure (Figure 9-8) :
- E5h OPTIONS (MFR_SPECIFIC_21)
- F0h MISC_CONFIG_OPTIONS options (MFR_SPECIFIC_32)
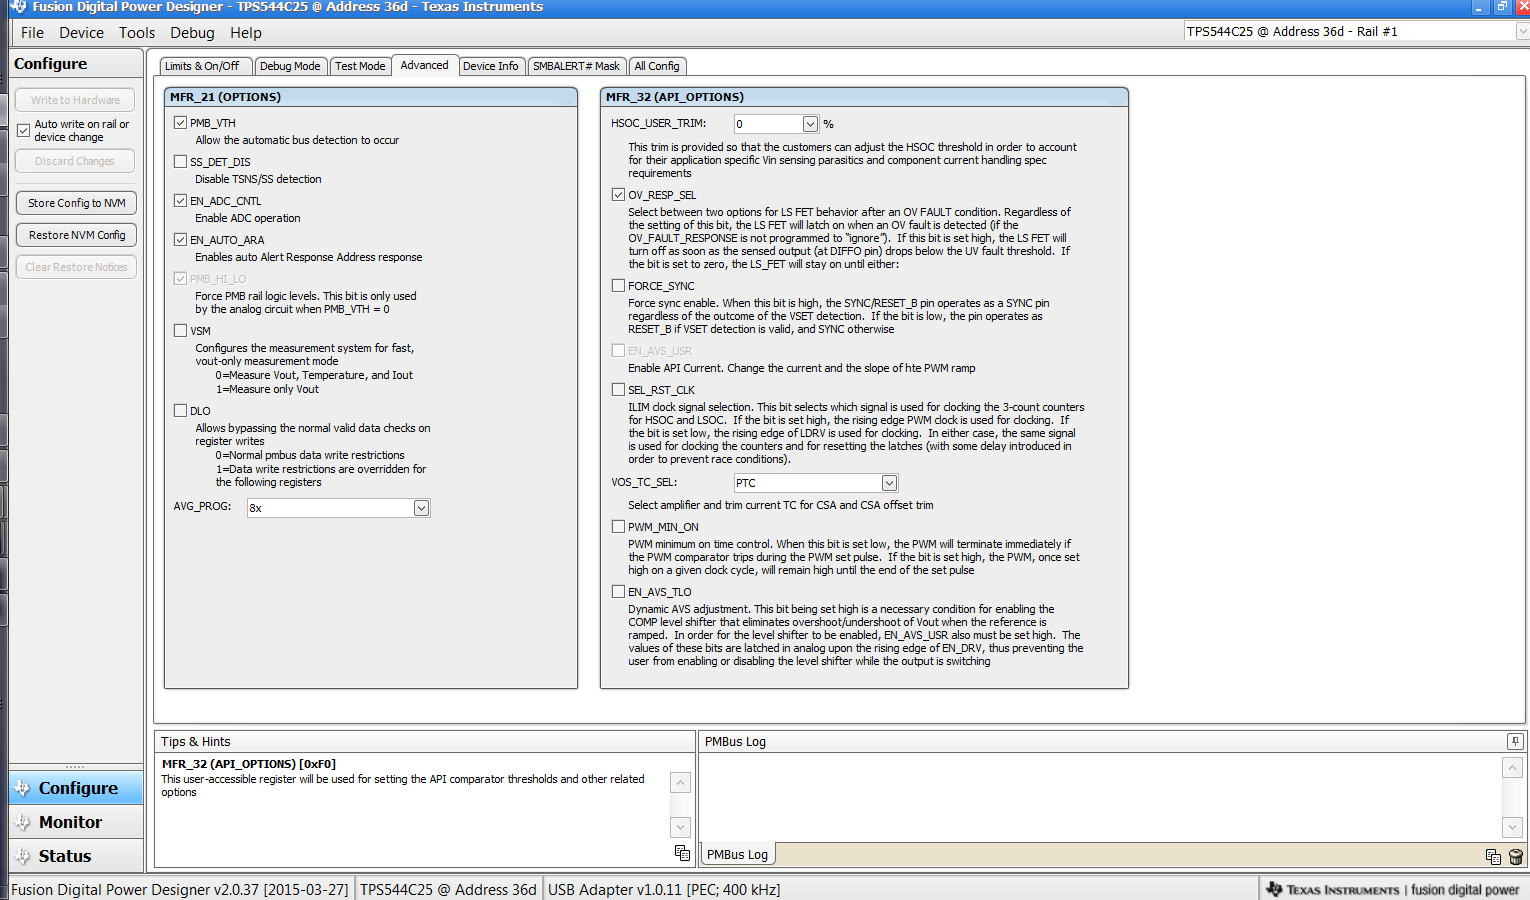 Figure 9-8 Configure: Advanced
The device information, User Scratch Pad, Write Protection options, the configuration of Vout Scale loop, Vout Transition Rate and Iout Offset can be found on "Device Info" tag (Figure 9-9). The IOUT offset can be typed in or scrolled to a new value. The range for IOUT cal offset is -4 A to 3.9375 A and the resolution step is 62.5 mA. If a value is typed in that is between the available discrete steps, the typed-in value does not change but the nearest discrete step is retained. The actual step is displayed on relaunch of the Fusion GUI.
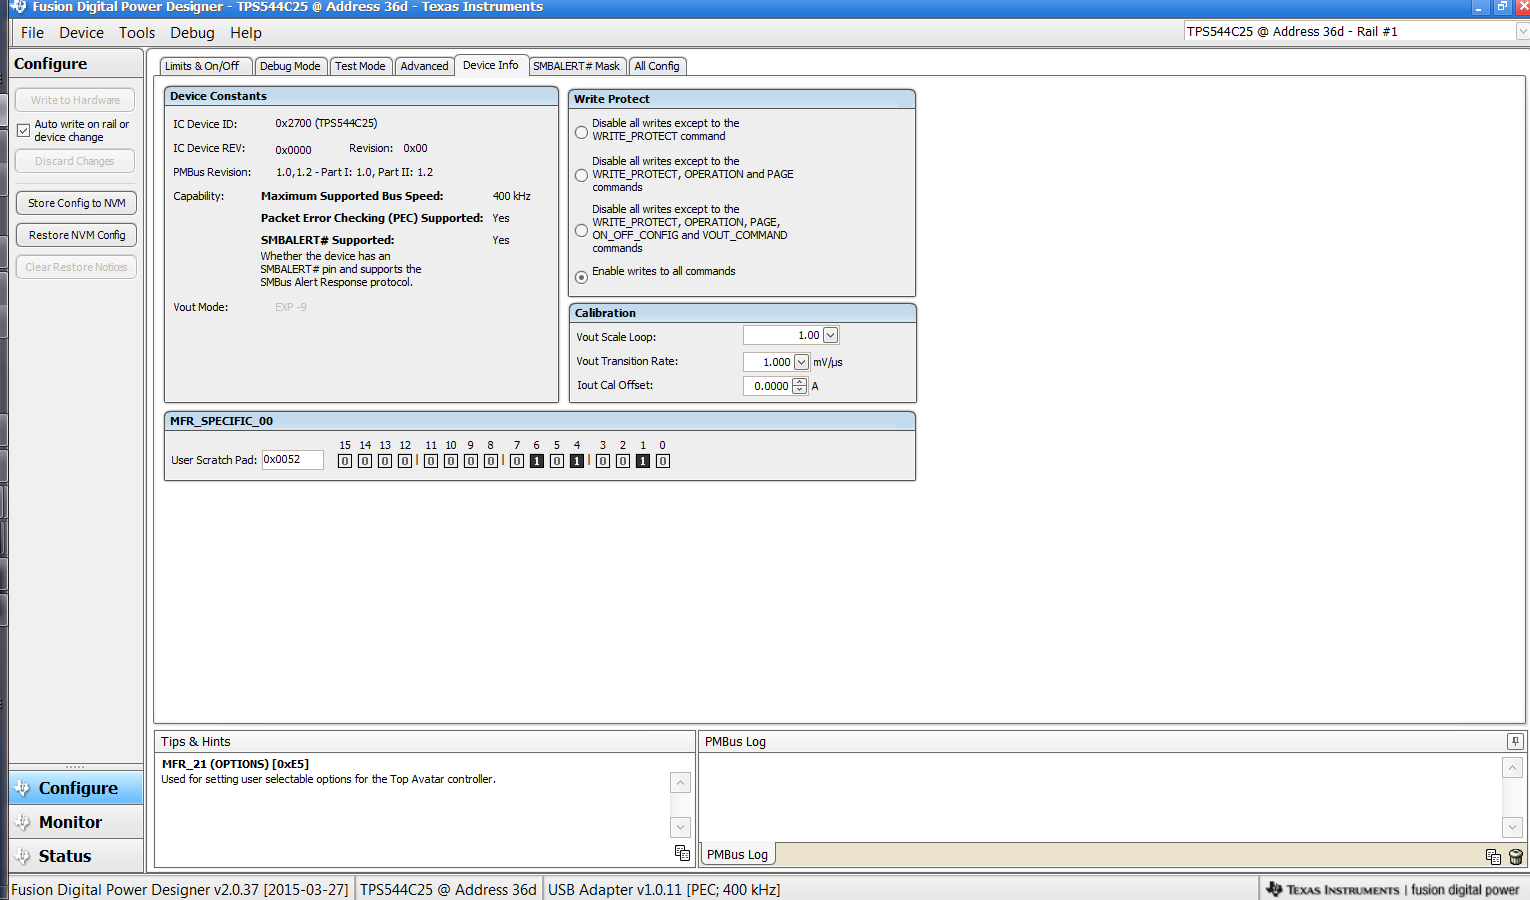 Figure 9-9 Configure: Device Info
The sources of SMBALERT which can be masked can be found and configured on the "SMBALERT # Mast" screen (Figure 9-10)
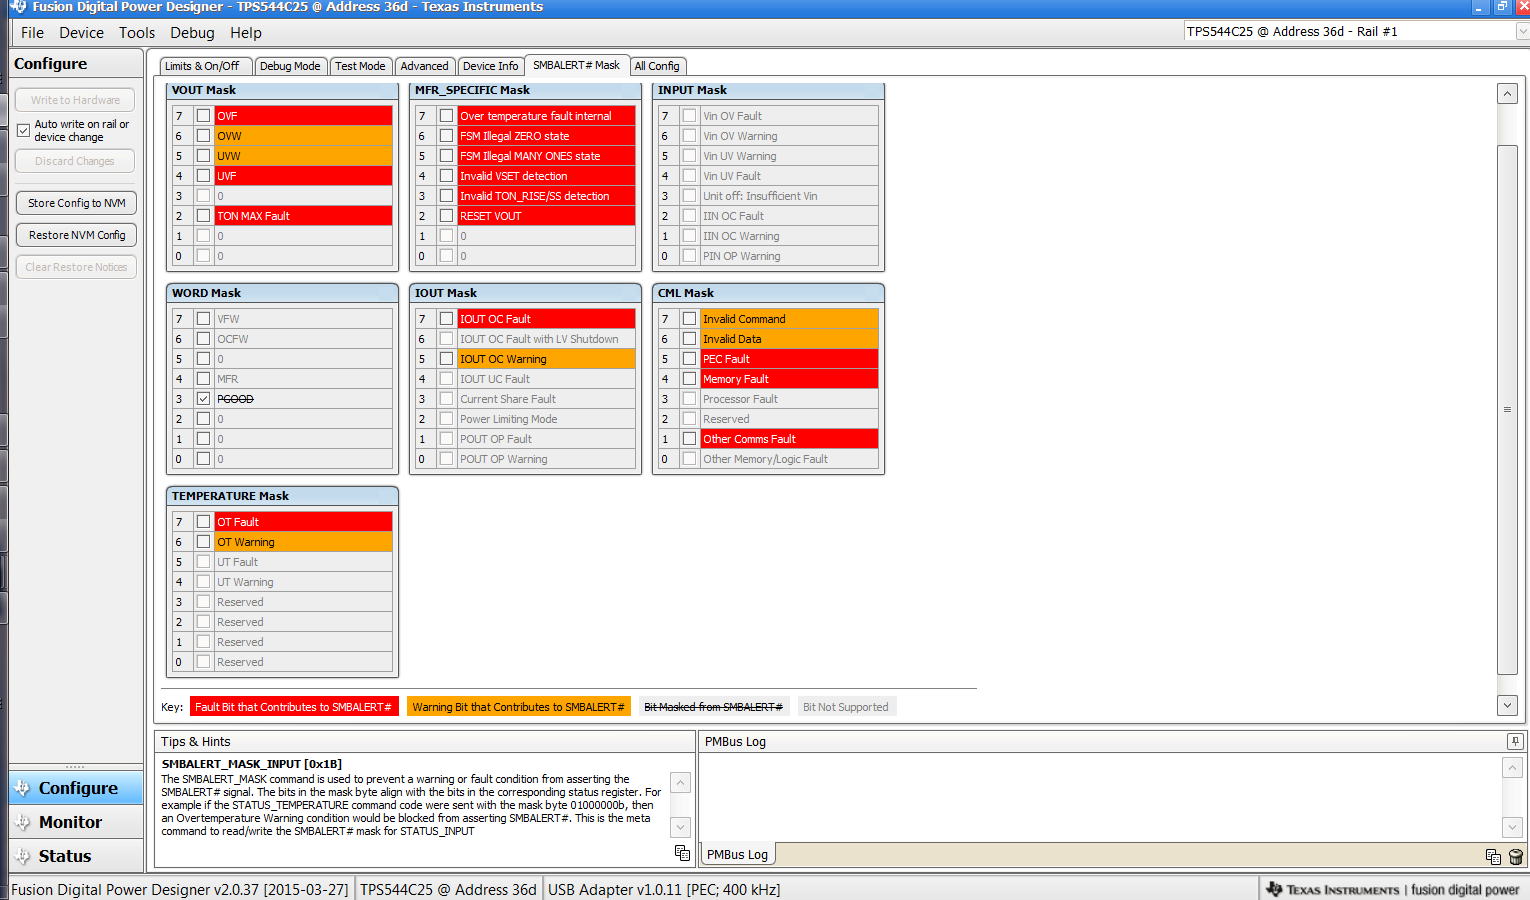 Figure 9-10 Configure: SMBALERT # Mask
Use "All Config" tag to configure all of the configurable parameters (Figure 9-11). The screen also shows other details like hexadecimal (hex) encoding.
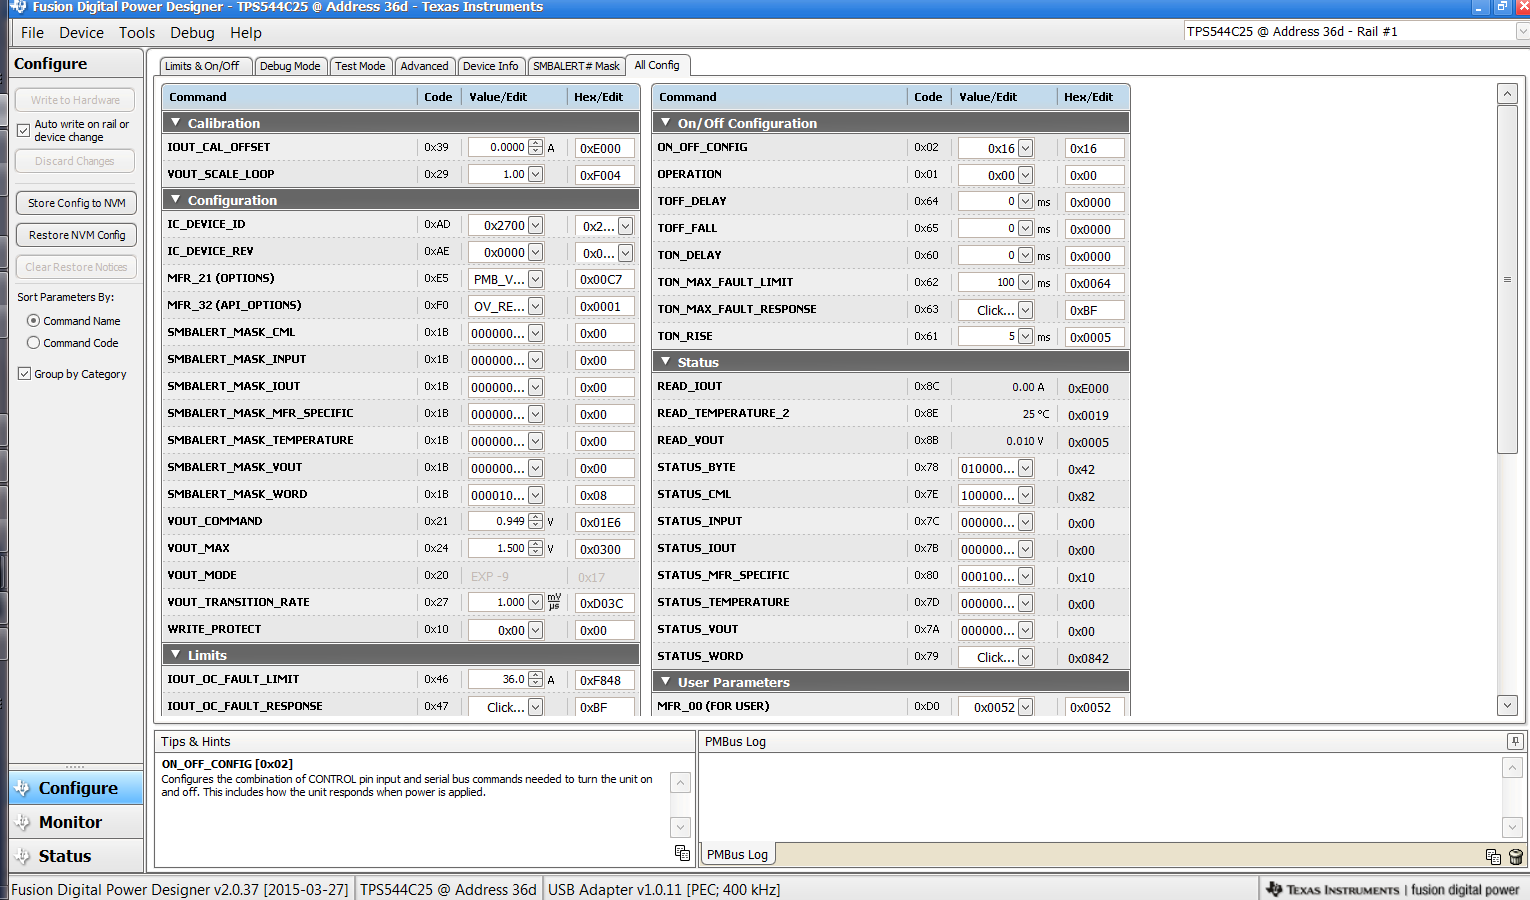 Figure 9-11 Configure: All
On/Off configuration can also be configured from the "All Config" screens, and the same process applies (Figure 9-12).
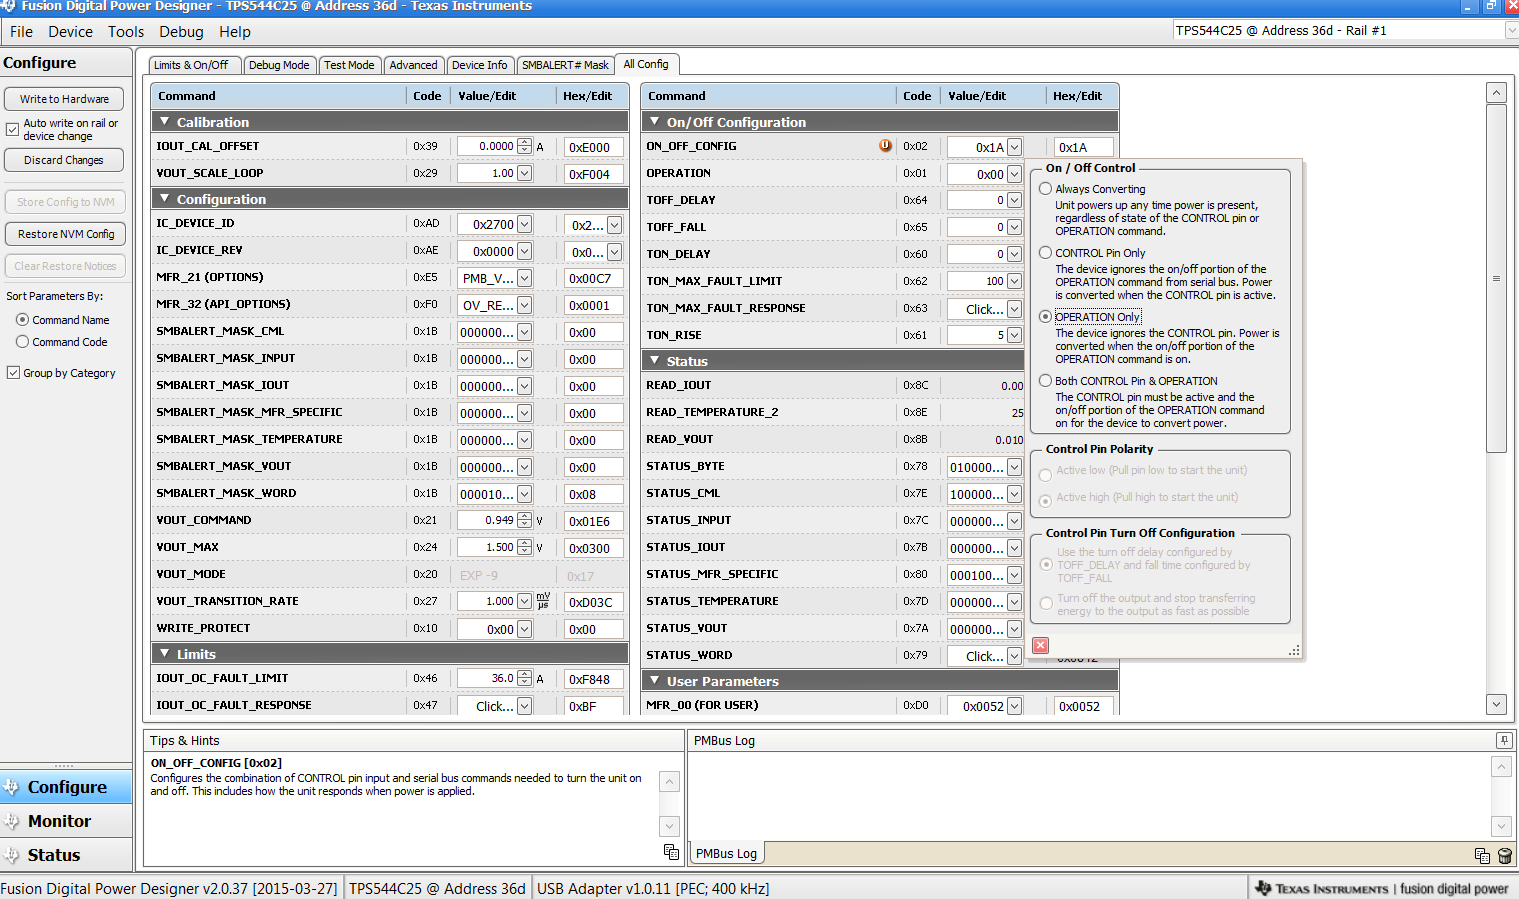 Figure 9-12 Configure: All Config- On/Off Config Pop-up
After making changes to one or more configurable parameters, the changes can be committed to nonvolatile memory by selecting Store Config to NVM. This action prompts a confirm selection pop-up, and if confirmed, the changes are committed to nonvolatile memory (Figure 9-13).
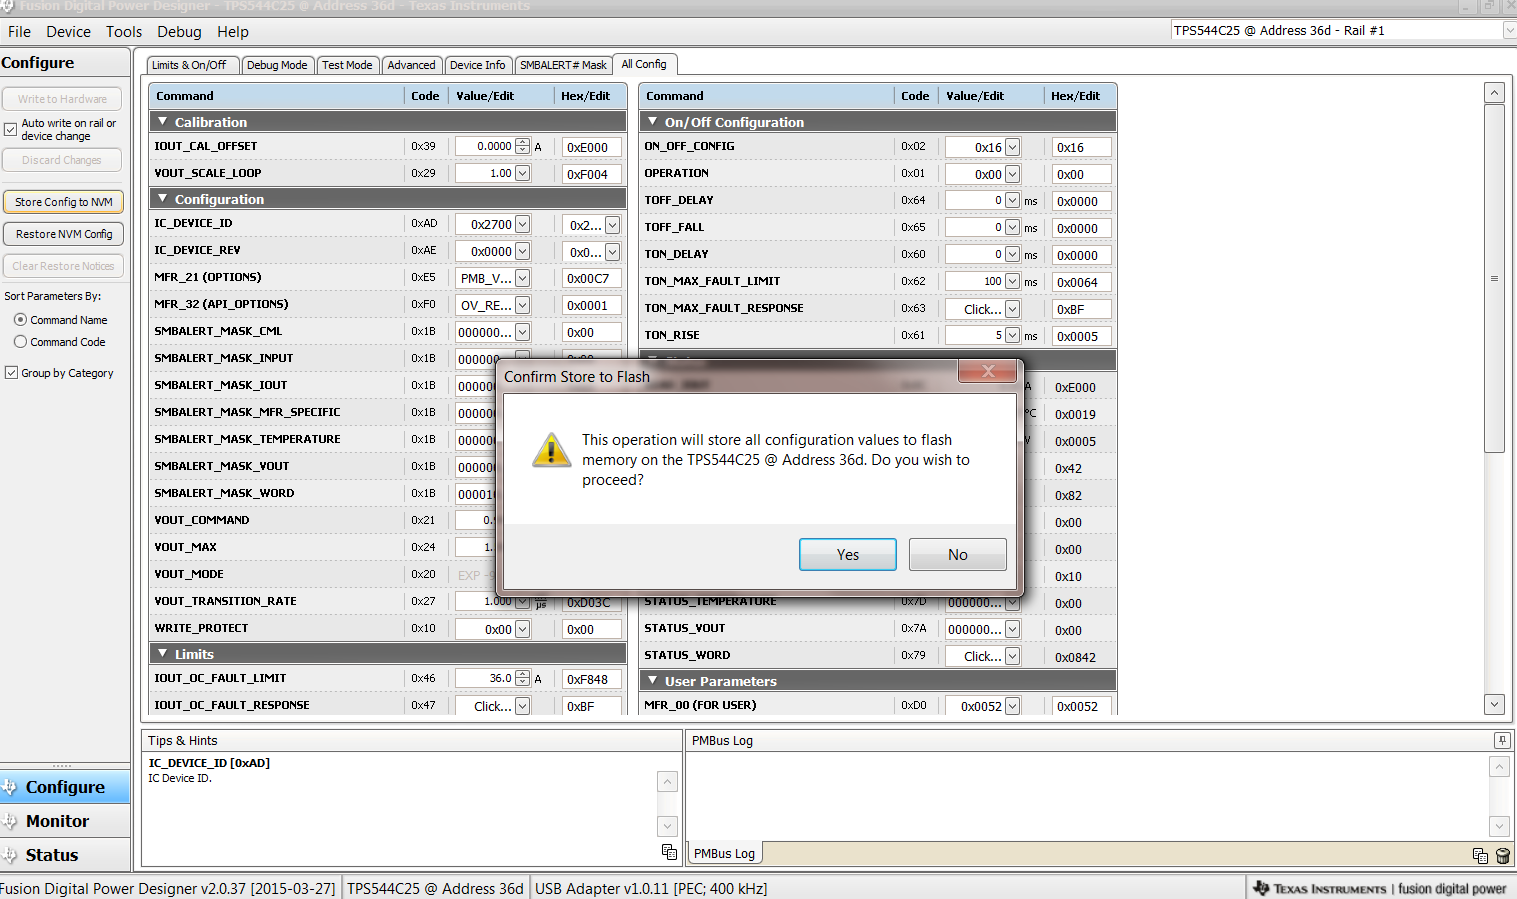 Figure 9-13 Configure: Store Config to NVM
In the lower left corner, the different view screens can be changed. The view screens can be changed between Configure, Monitor and Status as needed (Figure 9-14).
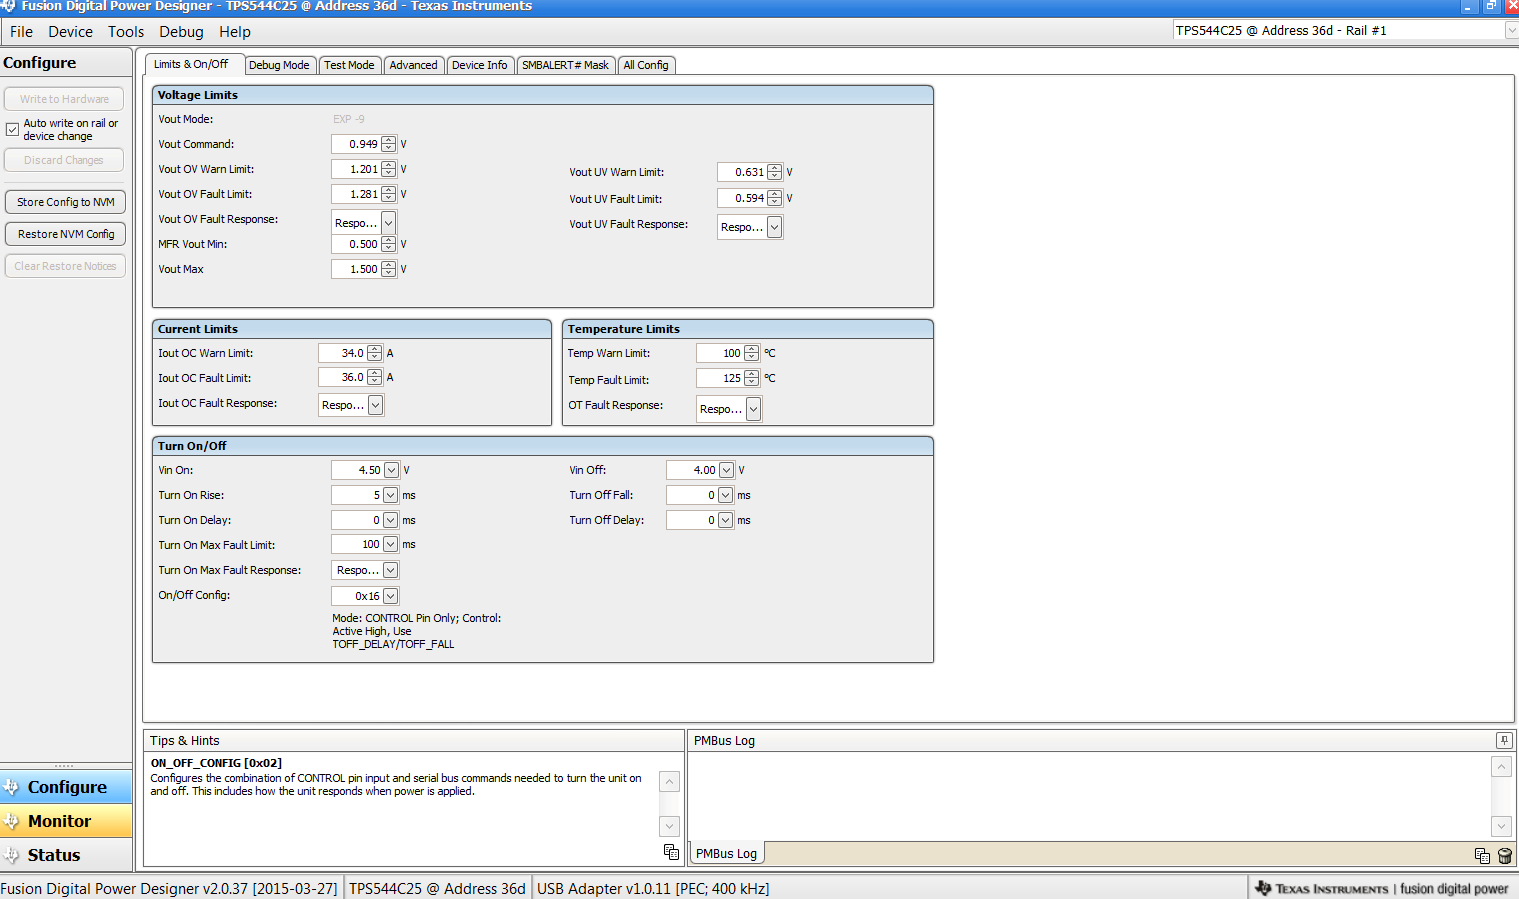 Figure 9-14 Change View Screen to Monitor Screen
When the Monitor screen is selected (Figure 9-15), the screen changes to display real-time data of the parameters that are measured by the controller. This screen provides access to:
- Graphs of VOUT, IOUT, and Temperature. As shown, Pout display is turned off.
- Start/Stop polling which turns on or off the real-time display of data.
- Clear Faults to clear any prior fault flags
- Quick access to on/off configuration
- Control pin activation, and operation command.
- PMBus log which displays activity on the PMBus.
- Tips and hints which displays additional information when the cursor is hovered over configurable parameters.
At first GUI launch, faults may occur due to communications during power up. These faults can be cleared once the device is enabled.
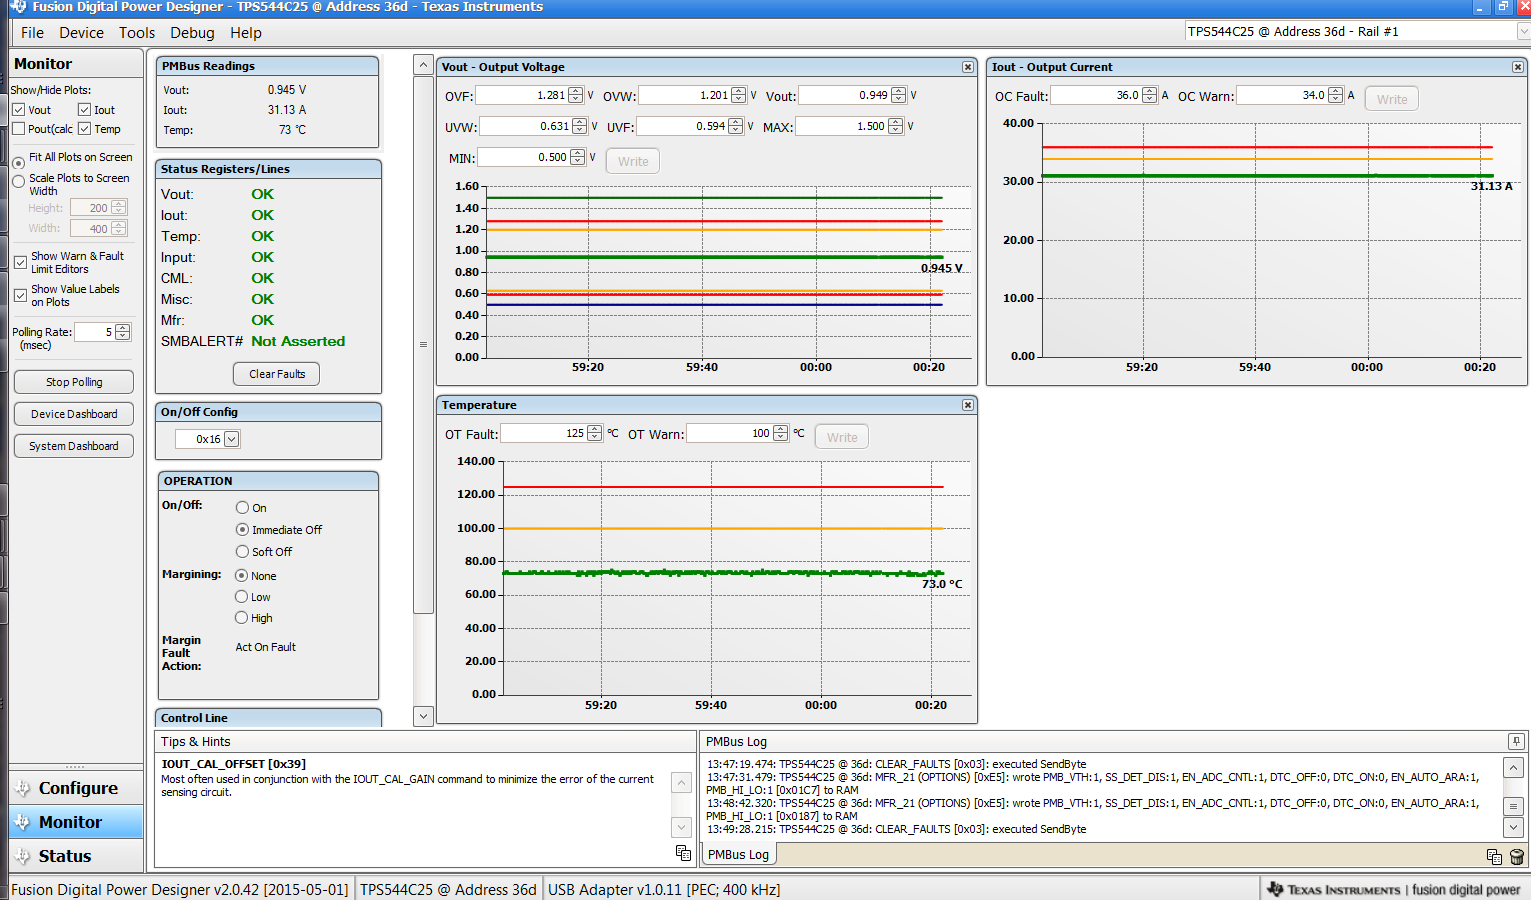 Figure 9-15 Monitor Screen
Selecting System Dashboard from mid-left screen adds a new window which displays system-level information (Figure 9-16).
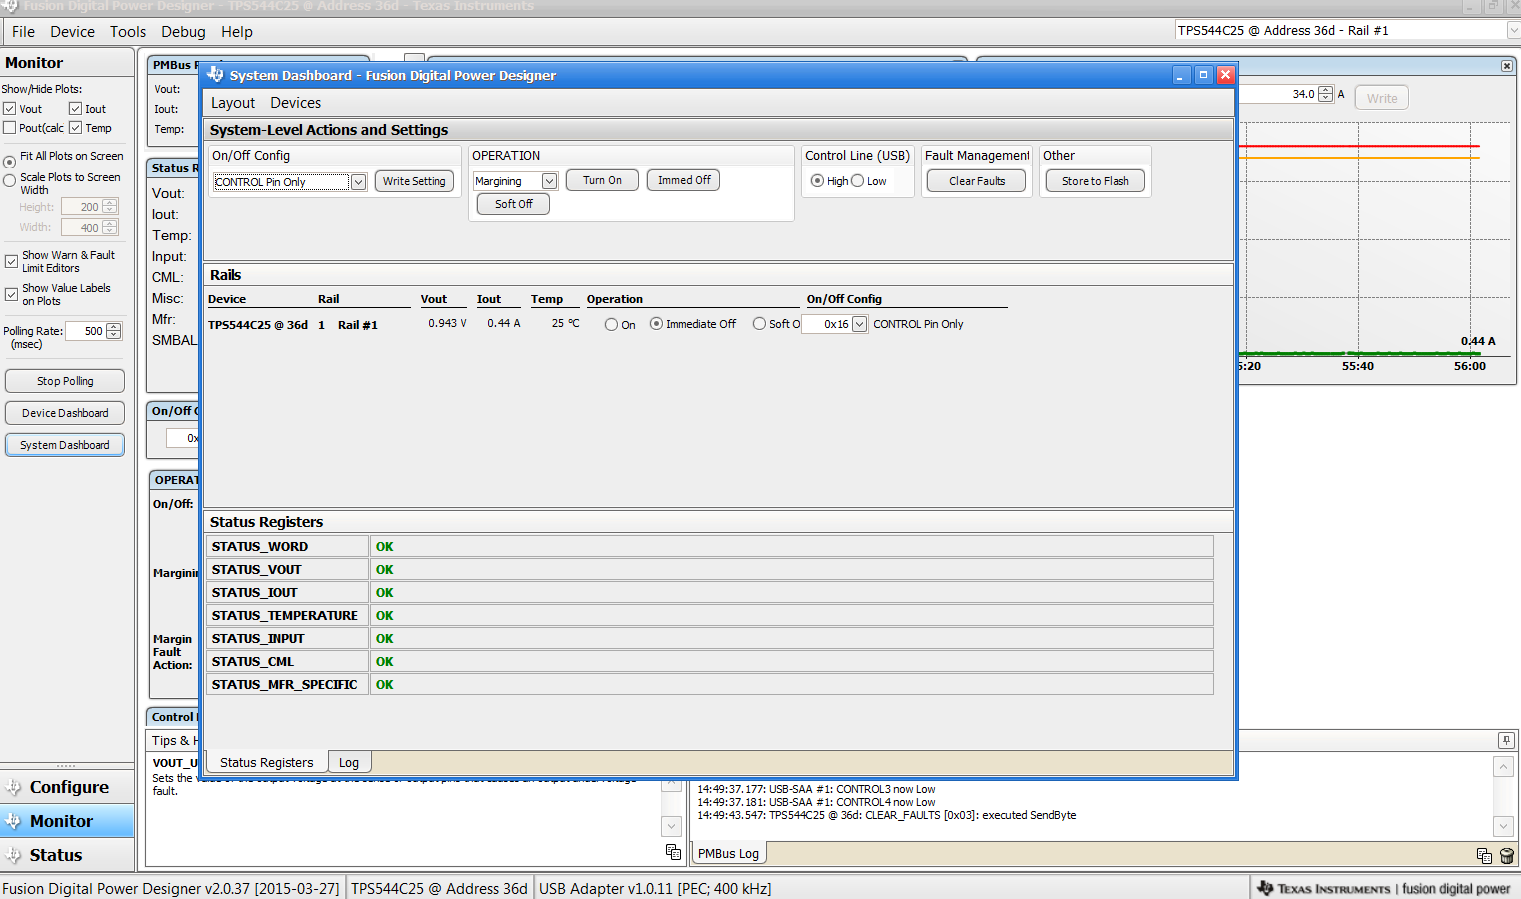 Figure 9-16 System Dashboard
Selecting Status from lower left corner shows the status of the controller (Figure 9-17).
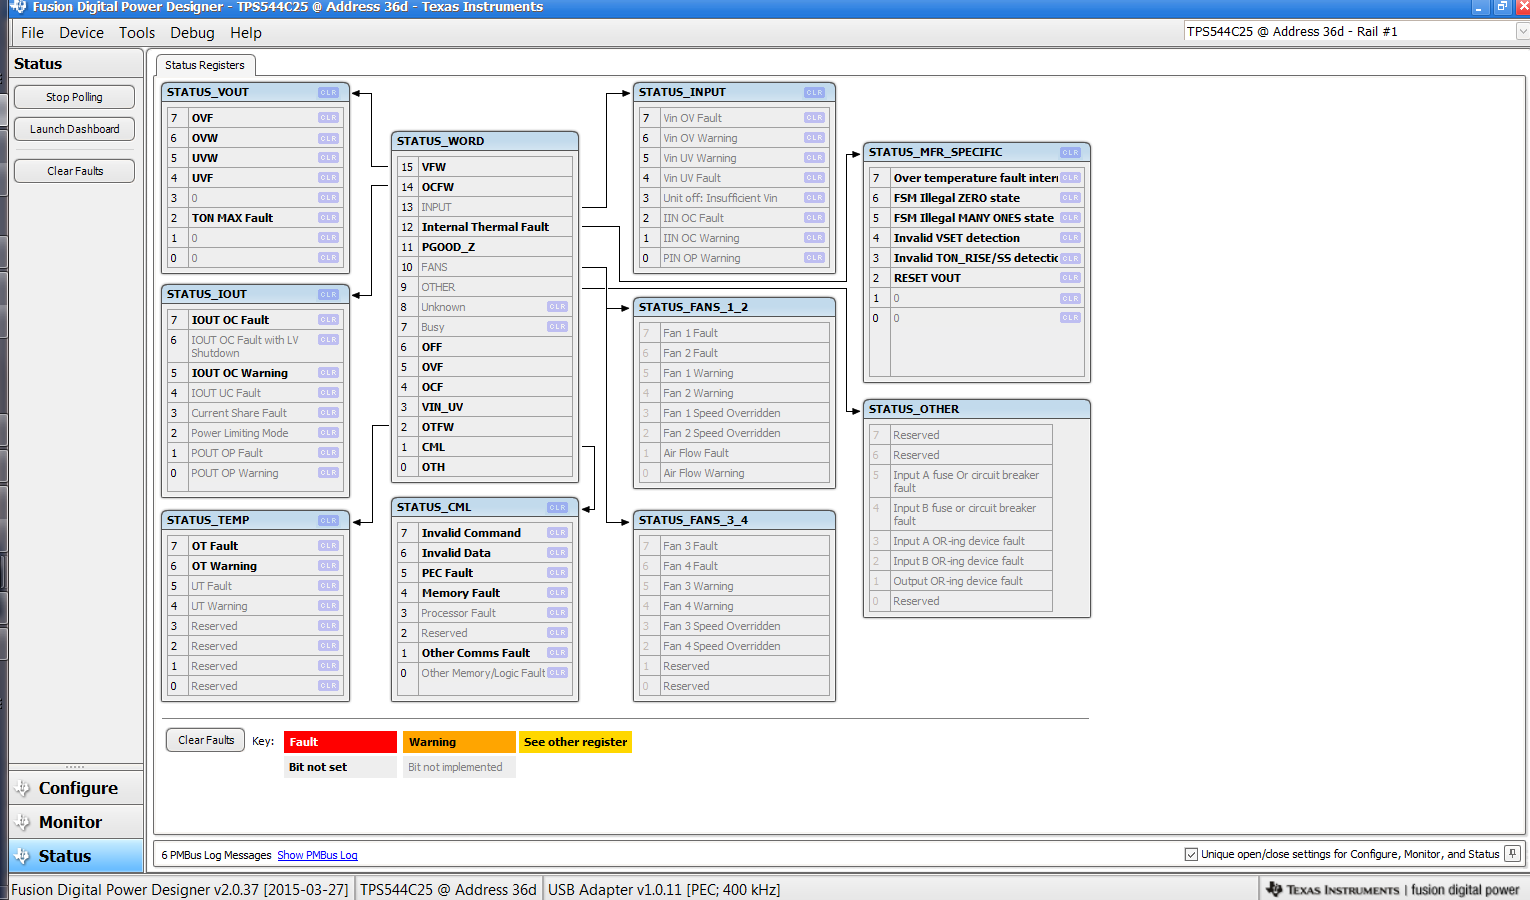 Figure 9-17 Status Screen
Selecting the pull-down menu File- Import Project from the upper left menu bar can be used to configure all parameters in the device at once with a desired configuration, or even revert back to a known-good configuration. This action results in a browse-type sequence where the desired configuration file can be located and loaded (Figure 9-18).
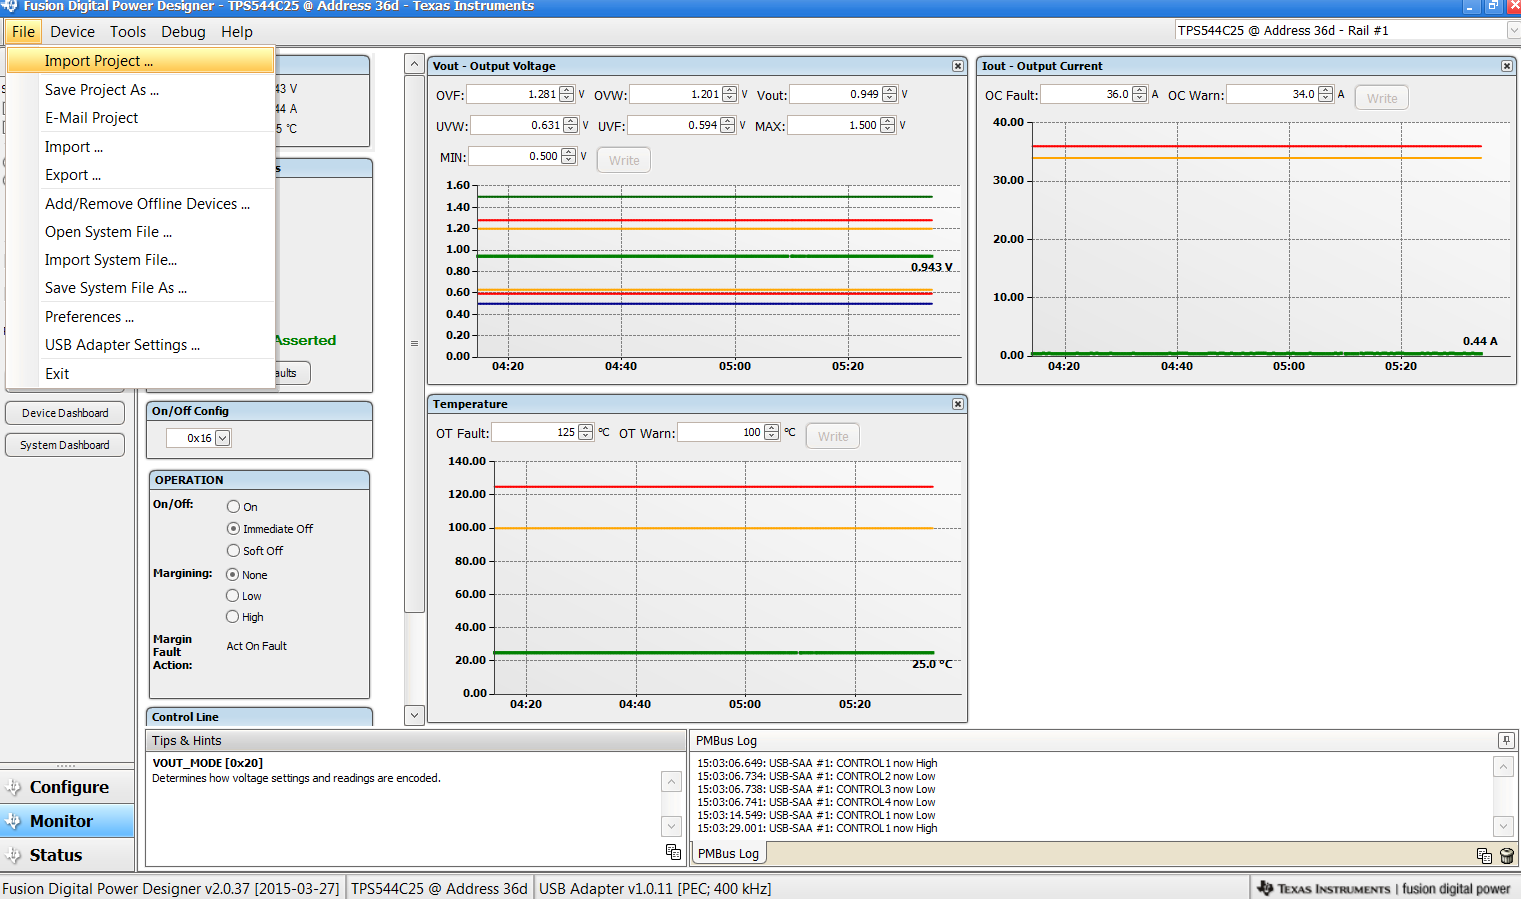 Figure 9-18 Import Project / Import Configuration File
Selecting Store User Configuration to Flash Memory from the device pull-down menu has the same functionality as the Store Config to NVM button from the configure screen. It results in committing the current configuration to nonvolatile memory (Figure 9-19).
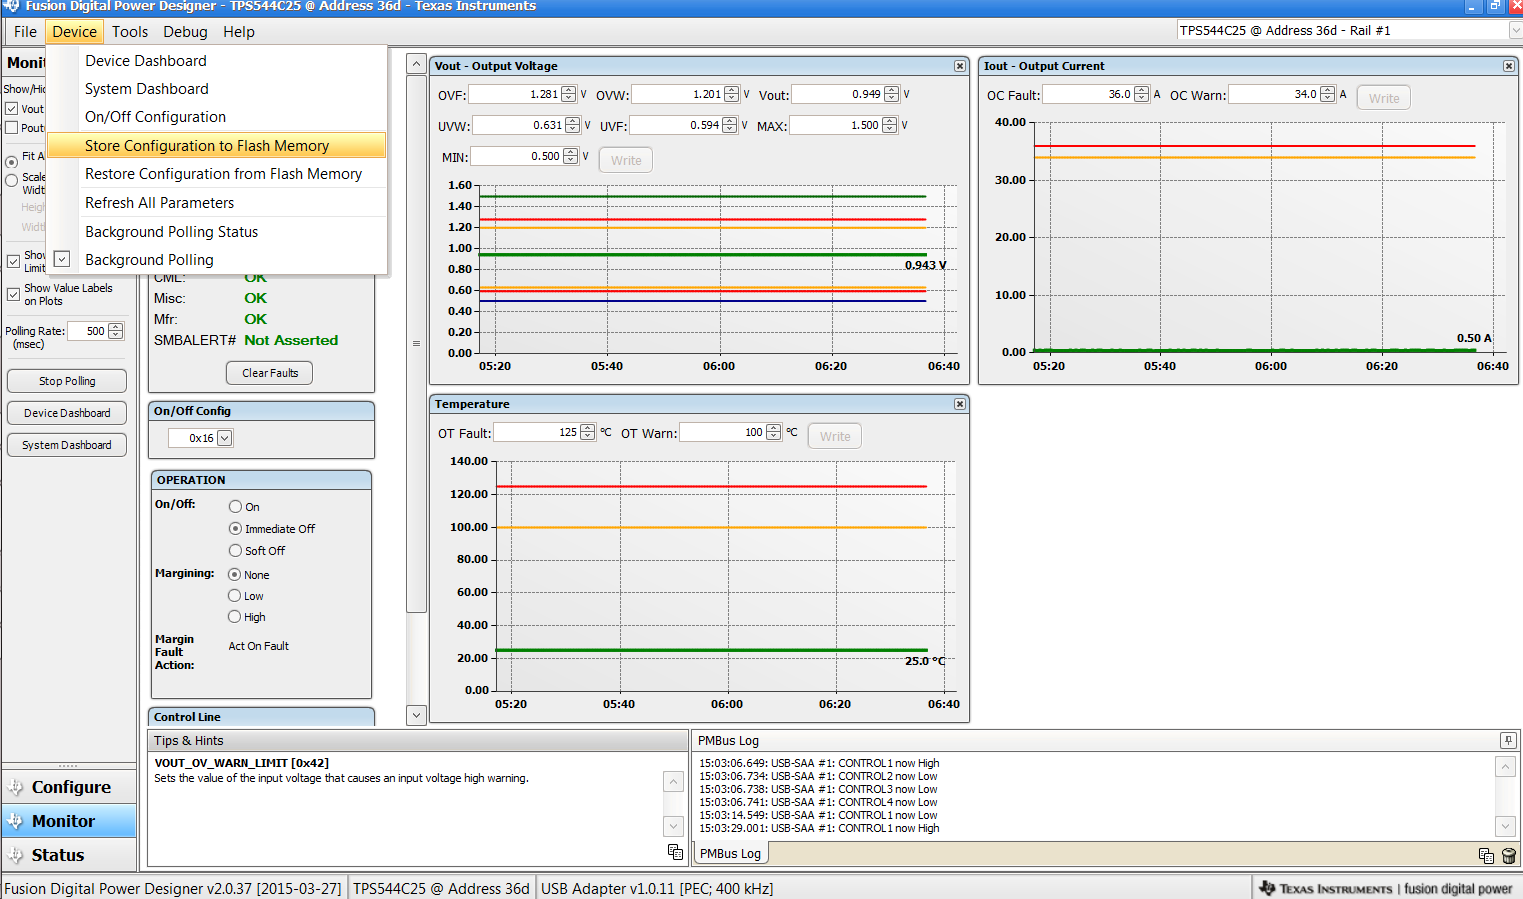 Figure 9-19 Store Configuration To Memory
Select Data Logging (Figure 9-20), from the Tools drop-down menu. This enables logging of common operating values such as VOUT, IOUT, and temperature. The user is prompted to select a location for the file to be stored as well as the type of file. Select the storage location for the file and the type of file. Logging begins when the Start Data Logging button is selected, and stops when it is reselected.
 Figure 9-20 Data
Logging
Figure 9-20 Data
LoggingCommon contents of the data log as shown in (Figure 9-21).
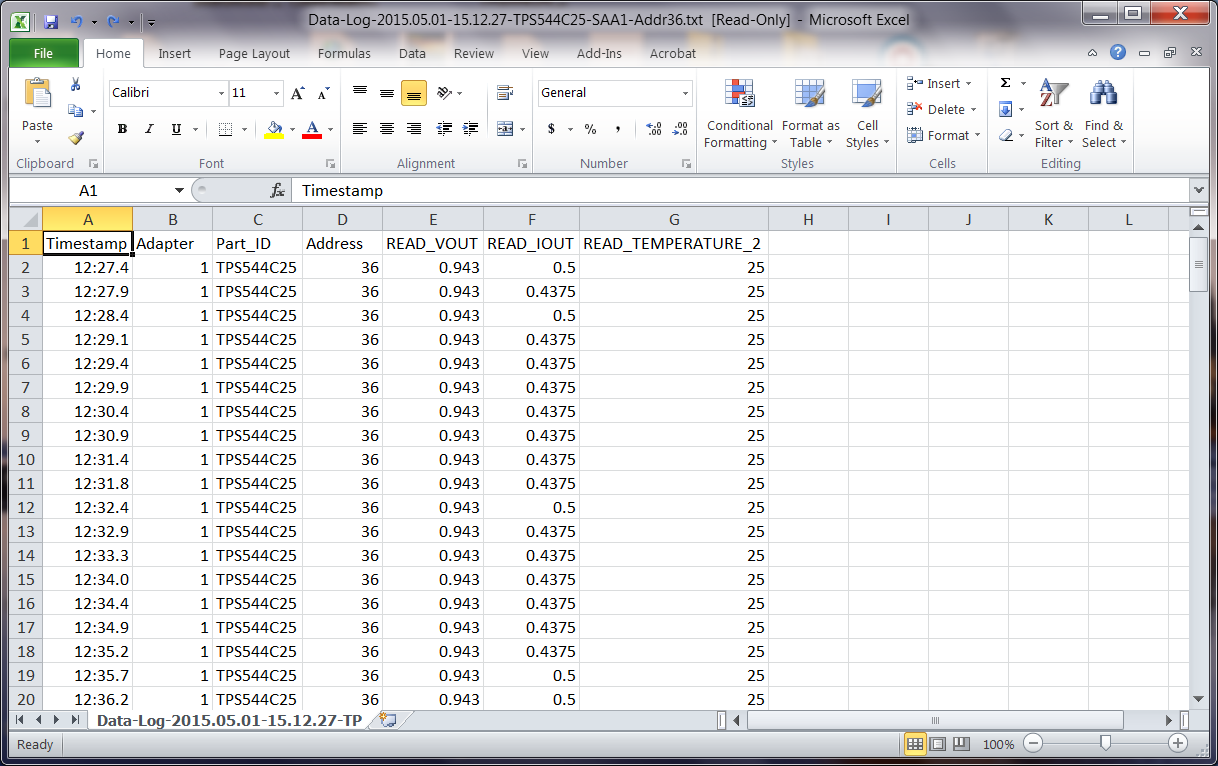 Figure 9-21 Data Log
File
Figure 9-21 Data Log
FileSelecting PMBus Logging (Figure 9-22) from the Tools drop-down menu enables the logging of all PMBus activity in the same way as the datalogging. This includes communications traffic for each polling loop between the GUI and the device. It also includes common operating values such as VOUT, IOUT, and temperature. The user is prompted to select a location for the file to be stored. See next screen (Figure 9-23).
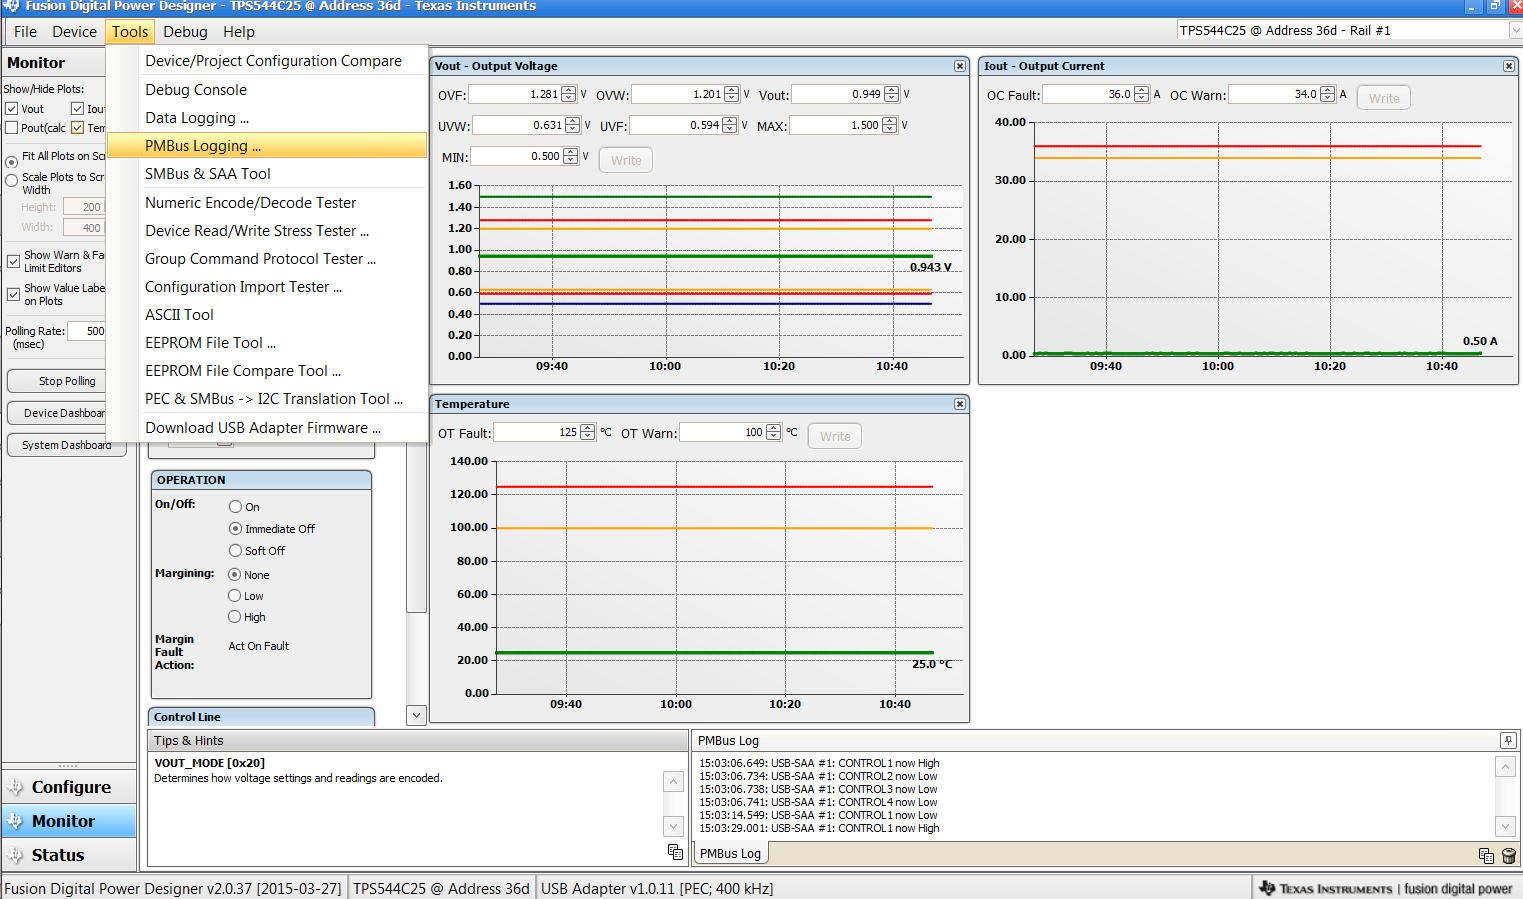 Figure 9-22 PMBus Logging
Select the storage location for the file and the type of file. As shown (Figure 9-23), the file is a CSV file to be stored in the directory path shown. Logging begins when the Start Logging button is selected, and stops when it is reselected (as Stop Logging). This file can rapidly grow in size, so caution is advised when using this function.
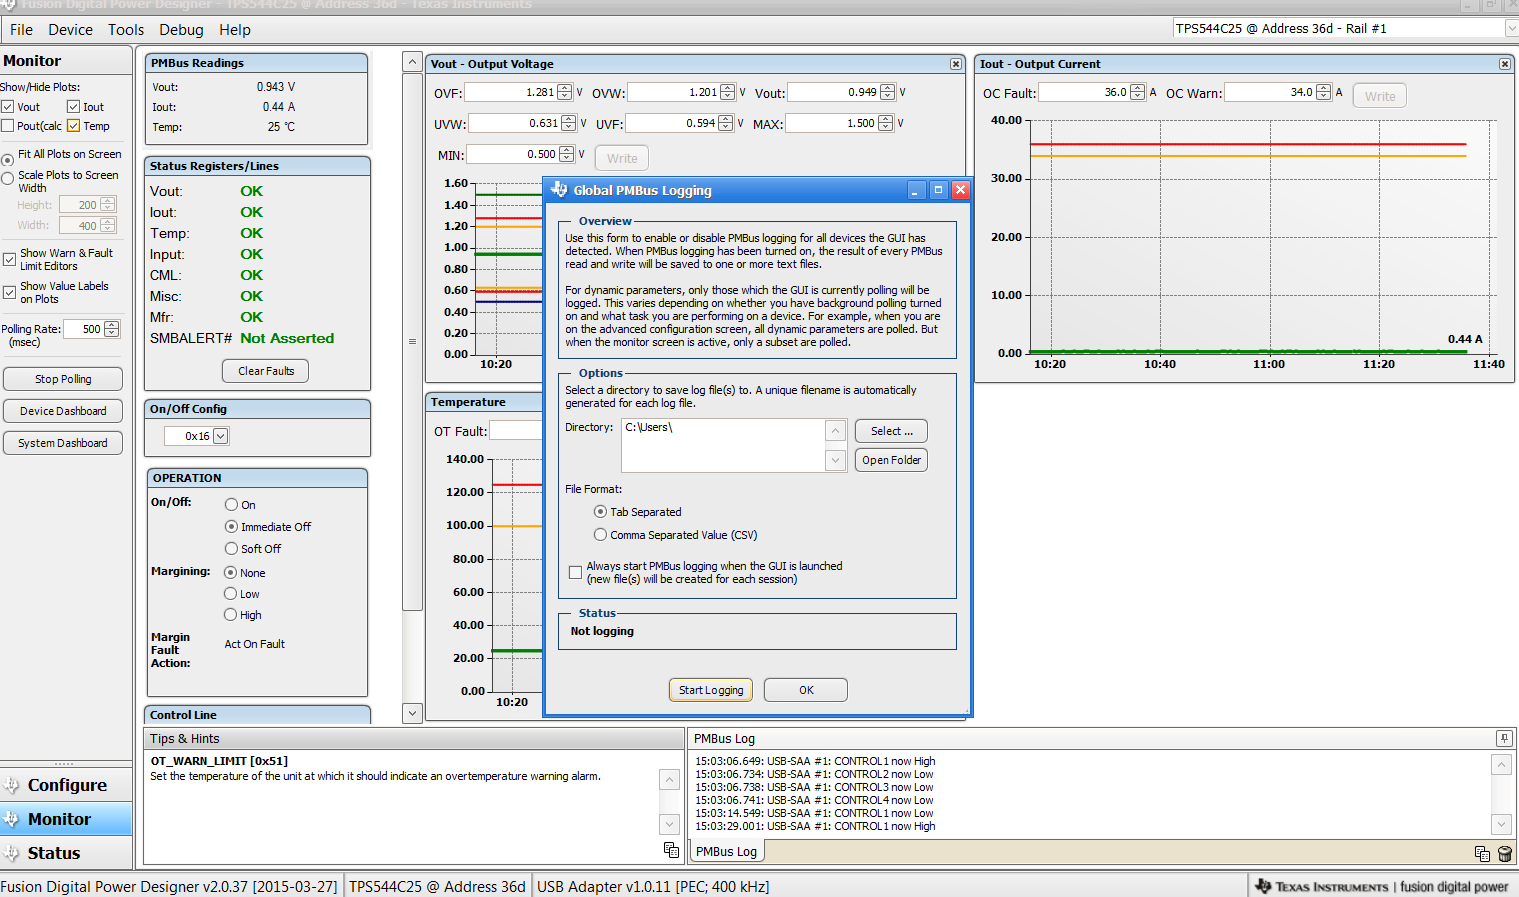 Figure 9-23 PMBus Log Details