SLVAEY8 November 2020 LM158QML-SP
DC Simulation Results
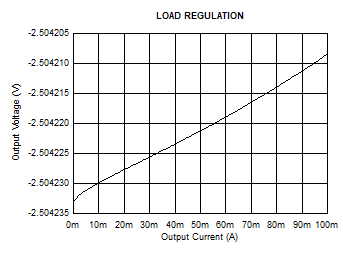
Load Regulation
The following plot shows the output voltage variation as the output current varies from 0 mA to 100 mA.

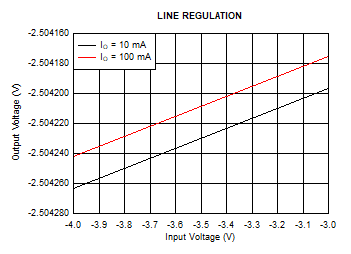
Line Regulation
The following plot shows the output voltage variation as the negative supply voltage varies from –4 V to –2 V.

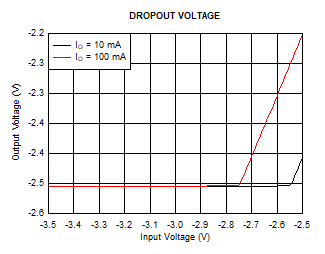
Dropout Voltage
The following plot shows the dropout voltage for load currents of 10 mA and 100 mA.
