SLVAFS9 August 2024 DRV8316 , DRV8317
3.3 Temporal Thermal Analysis
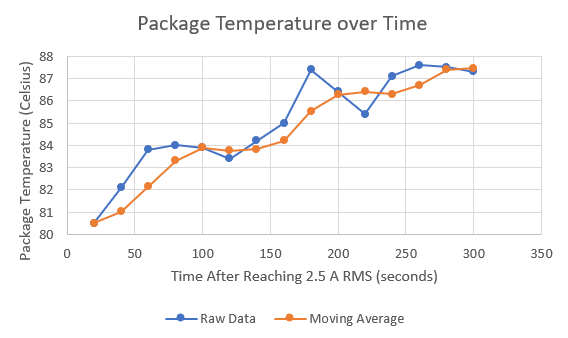
Lastly, the driver heats up over time. Based on the amount of time the application can require the motor driver to output high current, the temperature of the device changes. This affects different parameters of the device, especially the Rds(on) resistance. This resistance increases with higher temperatures, which increases the conduction power loss of the device. This continues until the resistance increase and device temperature saturates. Once the device disables the output, the temperature decreases rapidly. Figure 3-1 profiles the temperature over time. Any deviations in the trend are due to a variety of factors, such as measurement error or changes in motor parameters that can make the system more or less efficient.
 Figure 3-1 Package Temperature Over Time
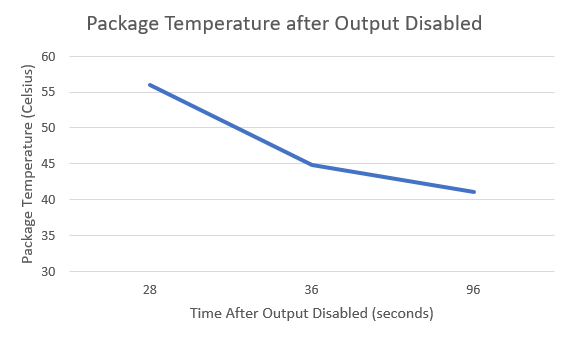
 Figure 3-2 Package Temperature After Output Disabled
The device cools off rapidly due in part to the thermal dissipation through the connected copper planes. Since the output is disabled, the dominating conduction power loss is no longer a major contributor to the total power loss, and so the temperature cools quickly.