SPRADG0A April 2024 – August 2024 AM62P , AM62P-Q1
3.1.1 LMBench
LMBench is a suite of micro benchmarks for processor cores and operating system primitives. The memory bandwidth and latency related tests are most relevant for modern embedded processors. The results vary a little (< 10%) run to run.
LMBench benchmark bw_mem measures achieved memory copy performance. With parameter cp, the benchmark does an array copy and bcopy parameter uses the runtime glibc version of memcpy() standard function. The glibc uses a highly optimized implementation that utilizes, for example, SIMD resulting in higher performance. The size parameter equal to or smaller than the cache size at a given level measures the achievable memory bandwidth from software doing a typical for loop or memcpy() type operation. Typical use is for external memory bandwidth calculation. The bandwidth is calculated as byte read and written counts as 1, which is roughly half of STREAM copy result. The benchmark further allows creating parallel threads with -P parameter. To get the maximum multi-core memory bandwidth, create the same amount of threads as there are cores available for the operating system, which is 4 for AM62Px Linux (-P 4). To show full performance characterization of the AM62Px, the LMBench tests are implemented on full factorial combinations of number of cores and clock frequency. The code block below shows terminal printout of executing the LMBench commands.
root@am62pxx-evm:~# bw_mem 8M bcopy
8.00 1956.71
root@am62pxx-evm:~# bw_mem -P 2 8M bcopy
8.00 3122.66
root@am62pxx-evm:~# bw_mem -P 4 8M bcopy
8.00 3605.80

root@am62pxx-evm:~# bw_mem 8M cp
8.00 1012.27
root@am62pxx-evm:~# bw_mem -P 2 8M cp
8.00 1568.78
root@am62pxx-evm:~# bw_mem -P 4 8M cp
8.00 1874.32
Table 3-1 shows the measured bandwidth and the efficiency compared to theoretical wire rate. The wire rate used is the LPDDR4 MT/s rate times the width divided by two (read and write making up a copy both consume the bus).
| Command | Description | Arm-Cortex-A53 at 1.25GHz, LPDDR4-3200MT/s-32 Bit [MB/s] | LPDDR4 Efficiency [%] | Arm-Cortex-A53 at 1.4GHz, LPDDR4-3200MT/s-32 Bit [MB/s] | LPDDR4 Efficiency [%] |
|---|---|---|---|---|---|
| Bw_mem 8M bcopy | Single core, glibc memcpy | 1,911 | 30 | 1,956 | 31 |
| bw_mem -P 2 8M bcopy | Dual core, glibc memcpy | 3,052 | 48 | 3,122 | 49 |
| bw_mem -P 4 8M bcopy |
Quad core, glibc memcpy | 3,571 | 56 | 3,605 | 56 |
| Bw_mem 8M cp | Single core, inline copy loop | 1,003 | 16 | 1,012 | 16 |
| bw_mem -P 2 8M cp |
Dual core, inline copy loop | 1,562 | 24 | 1,568 | 25 |
| bw_mem -P 4 8M cp |
Single core, inline copy loop | 1,862 | 29 | 1,874 | 29 |
LMBench benchmark lat_mem_rd is used to measure the observed memory access latency for external memory (LPDDR4 on AM62Px) and cache hits. The two arguments are the size of the transaction (64 in the code block below) and the stride of the read (512). These two values are selected to measure the latency to caches and external memory, not the processor data prefetchers or other speculative execution. For access patterns, the prefetching works, but this benchmark is most useful to measure the case when the prefetching does not.
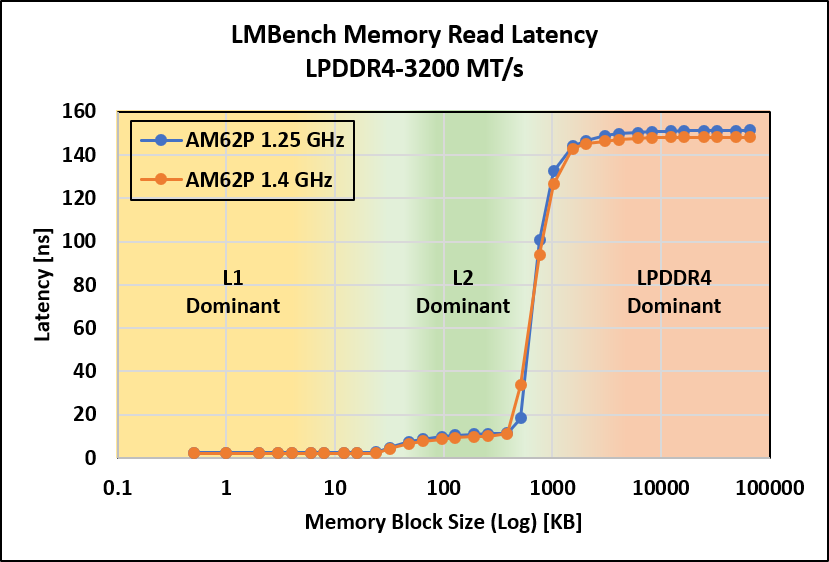
The code block below shoes the terminal printout of executing lat_mem_rd command. The left column is the size of the data access pattern in megabytes, right column is the round trip read latency in nanoseconds. This command is executed for Arm-Cortex-A53 clock frequency of 1.25GHz and 1.4GHz.
root@am62pxx-evm:~# lat_mem_rd 64 512
"stride=512
0.00049 2.145
0.00098 2.145
0.00195 2.145
0.00293 2.145
0.00391 2.145
0.00586 2.145
0.00781 2.145
0.01172 2.145
0.01562 2.145
0.02344 2.289
0.03125 4.179
0.04688 6.494
0.06250 7.748
0.09375 8.626
0.12500 9.283
0.18750 9.764
0.25000 9.976
0.37500 11.156
0.50000 33.705
0.75000 94.007
1.00000 126.437
1.50000 142.957
2.00000 145.089
3.00000 146.336
4.00000 147.029
6.00000 147.626
8.00000 147.867
12.00000 148.112
16.00000 148.169
24.00000 148.243
32.00000 148.219
48.00000 148.284
64.00000 148.291
Figure 3-1 shows connected scatter plots of memory latency results for both 1.25GHz and 1.4GHz. Based on memory block size (x-axis), the plot can be divided into three regions. The first region is when the accessed memory block is smaller than L1 cache. Assume that the data is completely inside the L1 and such the latency in this region is a close estimation of L1 cache latency. The second region is when the accessed memory block is bigger than L1 but smaller than L2 cache. The latency in this region is a mix of L1, L2, and LPDDR4 latency. The latency at the middle of that region can be assumed to be a close representation of L2 latency. The third region is when the access memory block is bigger than L2 cache. The last reading in this region reflects the LPDDR4 latency.
 Figure 3-1 Memory Read Latency
Table 3-2 shows a summary for Arm-Cortex-A53 read latency.
| Memory | Arm-Cortex-A53 at 1.25GHz [ns] | Arm-Cortex-A53 at 1.4GHz [ns] |
|---|---|---|
| L1 cache | 2.4 | 2.1 |
| L2 cache | 10.4 | 9.2 |
| LPDDR4-3200 MT/s | 151.3 | 148.2 |