SPRADH0 August 2024 AM625 , AM6442 , AM69 , TDA4VM
- 1
- Abstract
- Trademarks
- 1Introduction
- 2Evaluation Platform and Methods
- 3Performance Metrics
- 4Optimizations
- 5Summary
- 6References
- 7Appendix A: How to Setup TI Embedded Processors as EtherCAT Controller Using the CODESYS Stack
- 8Appendix B: How to Enable Unlimited Runtime on CODESYS Stack
3.1 Cyclictest Performance Metrics
Before evaluating the performance of each hardware platform when running an EtherCAT application, gathering baseline performance statistics from running cyclictest is typically recommended. These statistics are a good indicator to the performance of an EtherCAT controller when running the CODESYS stack.
cyclictest is a utility tool in Linux (see also, the Linux Foundation) that accurately and repeatedly measures the difference between the intended wake-up time of a thread and the time at which the thread actually wakes up to provide statistics about the latencies of the system. Latencies caused by hardware, firmware, and the operating system in real-time systems can be measured by cyclictest.
The results of cyclictest are plotted in the same histogram format as the data Open Source Automation Development Lab (OSADL) publishes in QA Farm on Real-time of Mainline Linux. OSADL is an organization intended to facilitate individuals, groups, and companies to develop Open Source software by bringing in a broader community to help with development. A service provided by OSADL is the QA farm, which is a quality assurance and assessment test center for embedded systems.
The results of cyclictest were captured on the AM62x evaluation board (SK-AM62B), AM64x evaluation board (TMDS64EVM), TDA4VM starter kit (SK-TDA4VM), and AM69 starter kit (SK-AM69) to show the base latencies running on these platforms. SK-AM62B and TMDS64EVM ran on PROCESSOR-SDK-LINUX-RT-AM62x and PROCESSOR-SDK-LINUX-RT-AM64x default wic image, respectively, from Software Development Kit (SDK) version 09.01.00.08. The TDA4VM and AM69 ran on real-time builds from the respective SDK 09.01.00.06 versions. Each cyclictest ran for 6 hours under stress test using the stress-ng tool. See the following code snippet for this setup.
stress-ng -c <number of cpu cores> --cpu-method all &
cyclictest -m -Sp98 -D6h -h400 -i200 -q > <histogram name>.hist
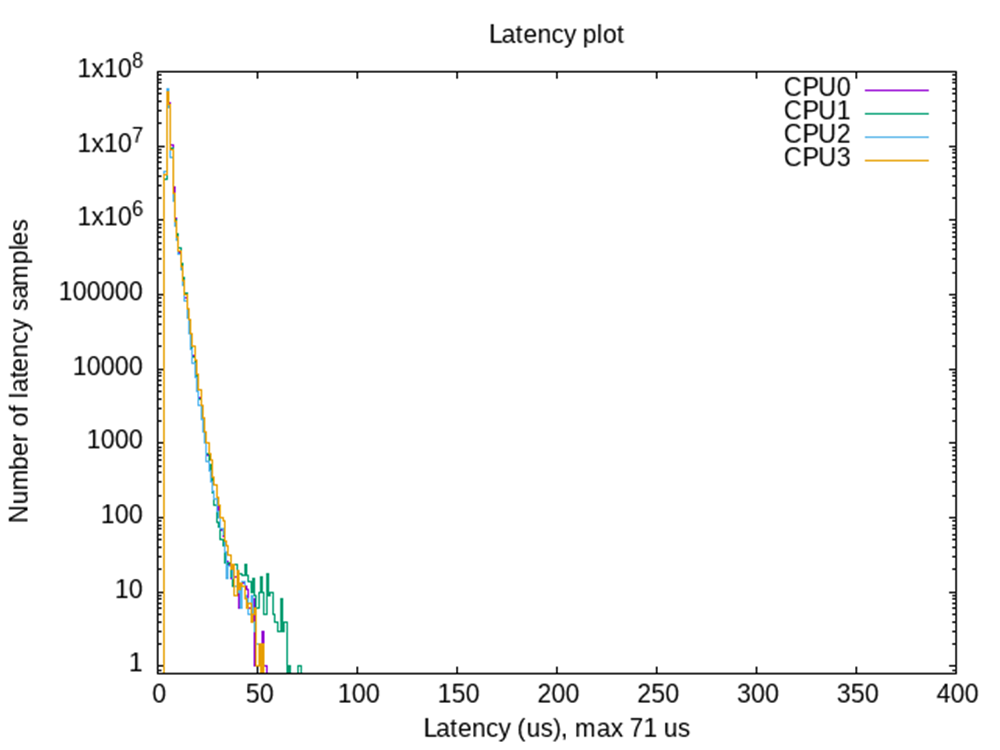
Figure 3-1 Latency Plot for AM62x Running for 6 Hours Under stress-ng
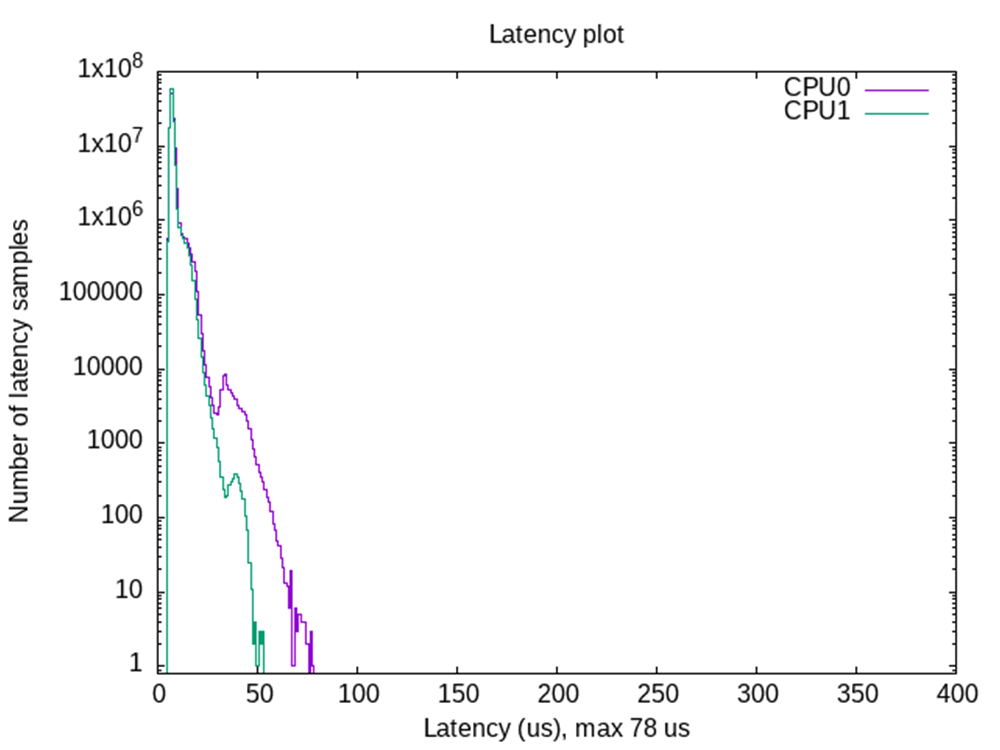
 Figure 3-2 Latency Plot for AM64x Running for 6 Hours Under stress-ng
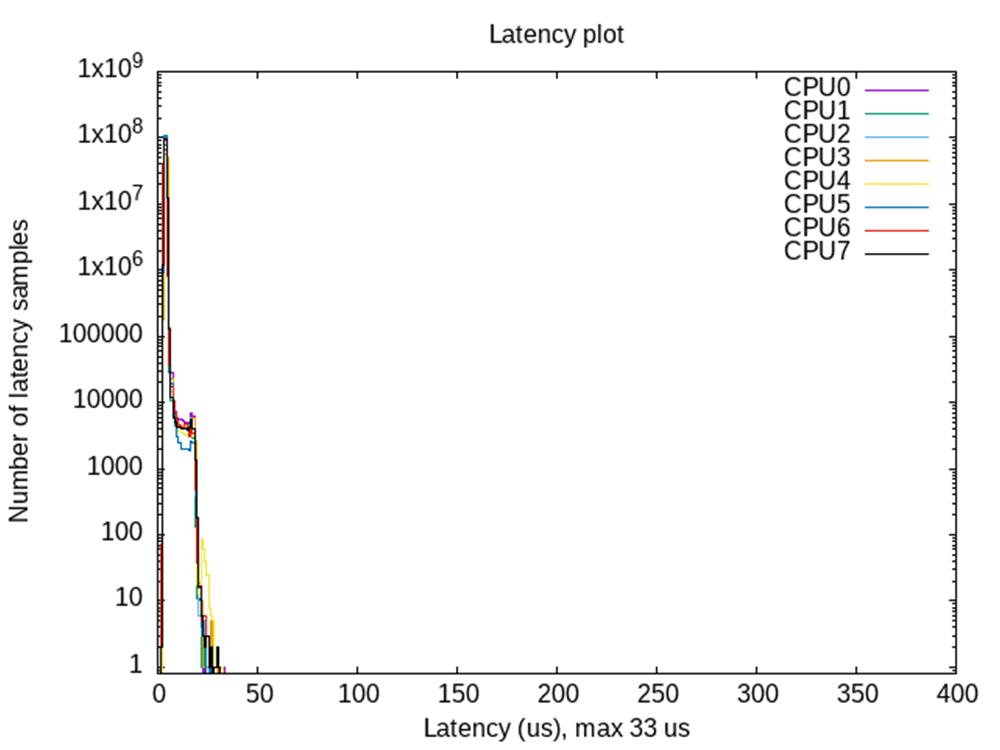
 Figure 3-3 Latency Plot for AM69 Running for 6 Hours Under stress-ng
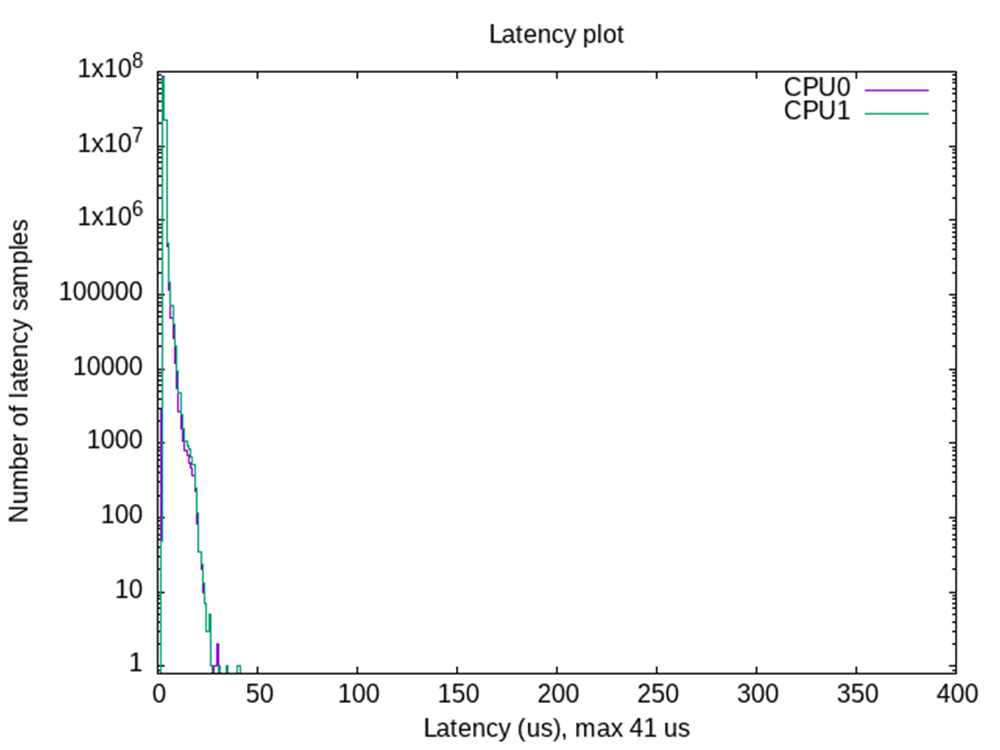
 Figure 3-4 Latency Plot for the TDA4VM Running for 6 Hours Under stress-ng