SPRADI0A July 2024 – November 2024
4.2 C2000 Timer-Based Profiling
C2000 timer peripheral can also be used to get the execution time data. The timer code needs to be integrated with the existing model for profiling making this method an intrusive profiling method. The overhead incurred by the timer-based method can be removed by separately measuring the timer execution time. While running the code for the application, the timer code can be removed to save on additional cycles for timer configuration and running. Steps to be taken to profile a section or complete application code using C2000 timer peripheral are discussed below. The current example uses Timer 2 as the profiling tool, but if the timer is already in use by the application, then it is recommended to choose a timer that is not in use.
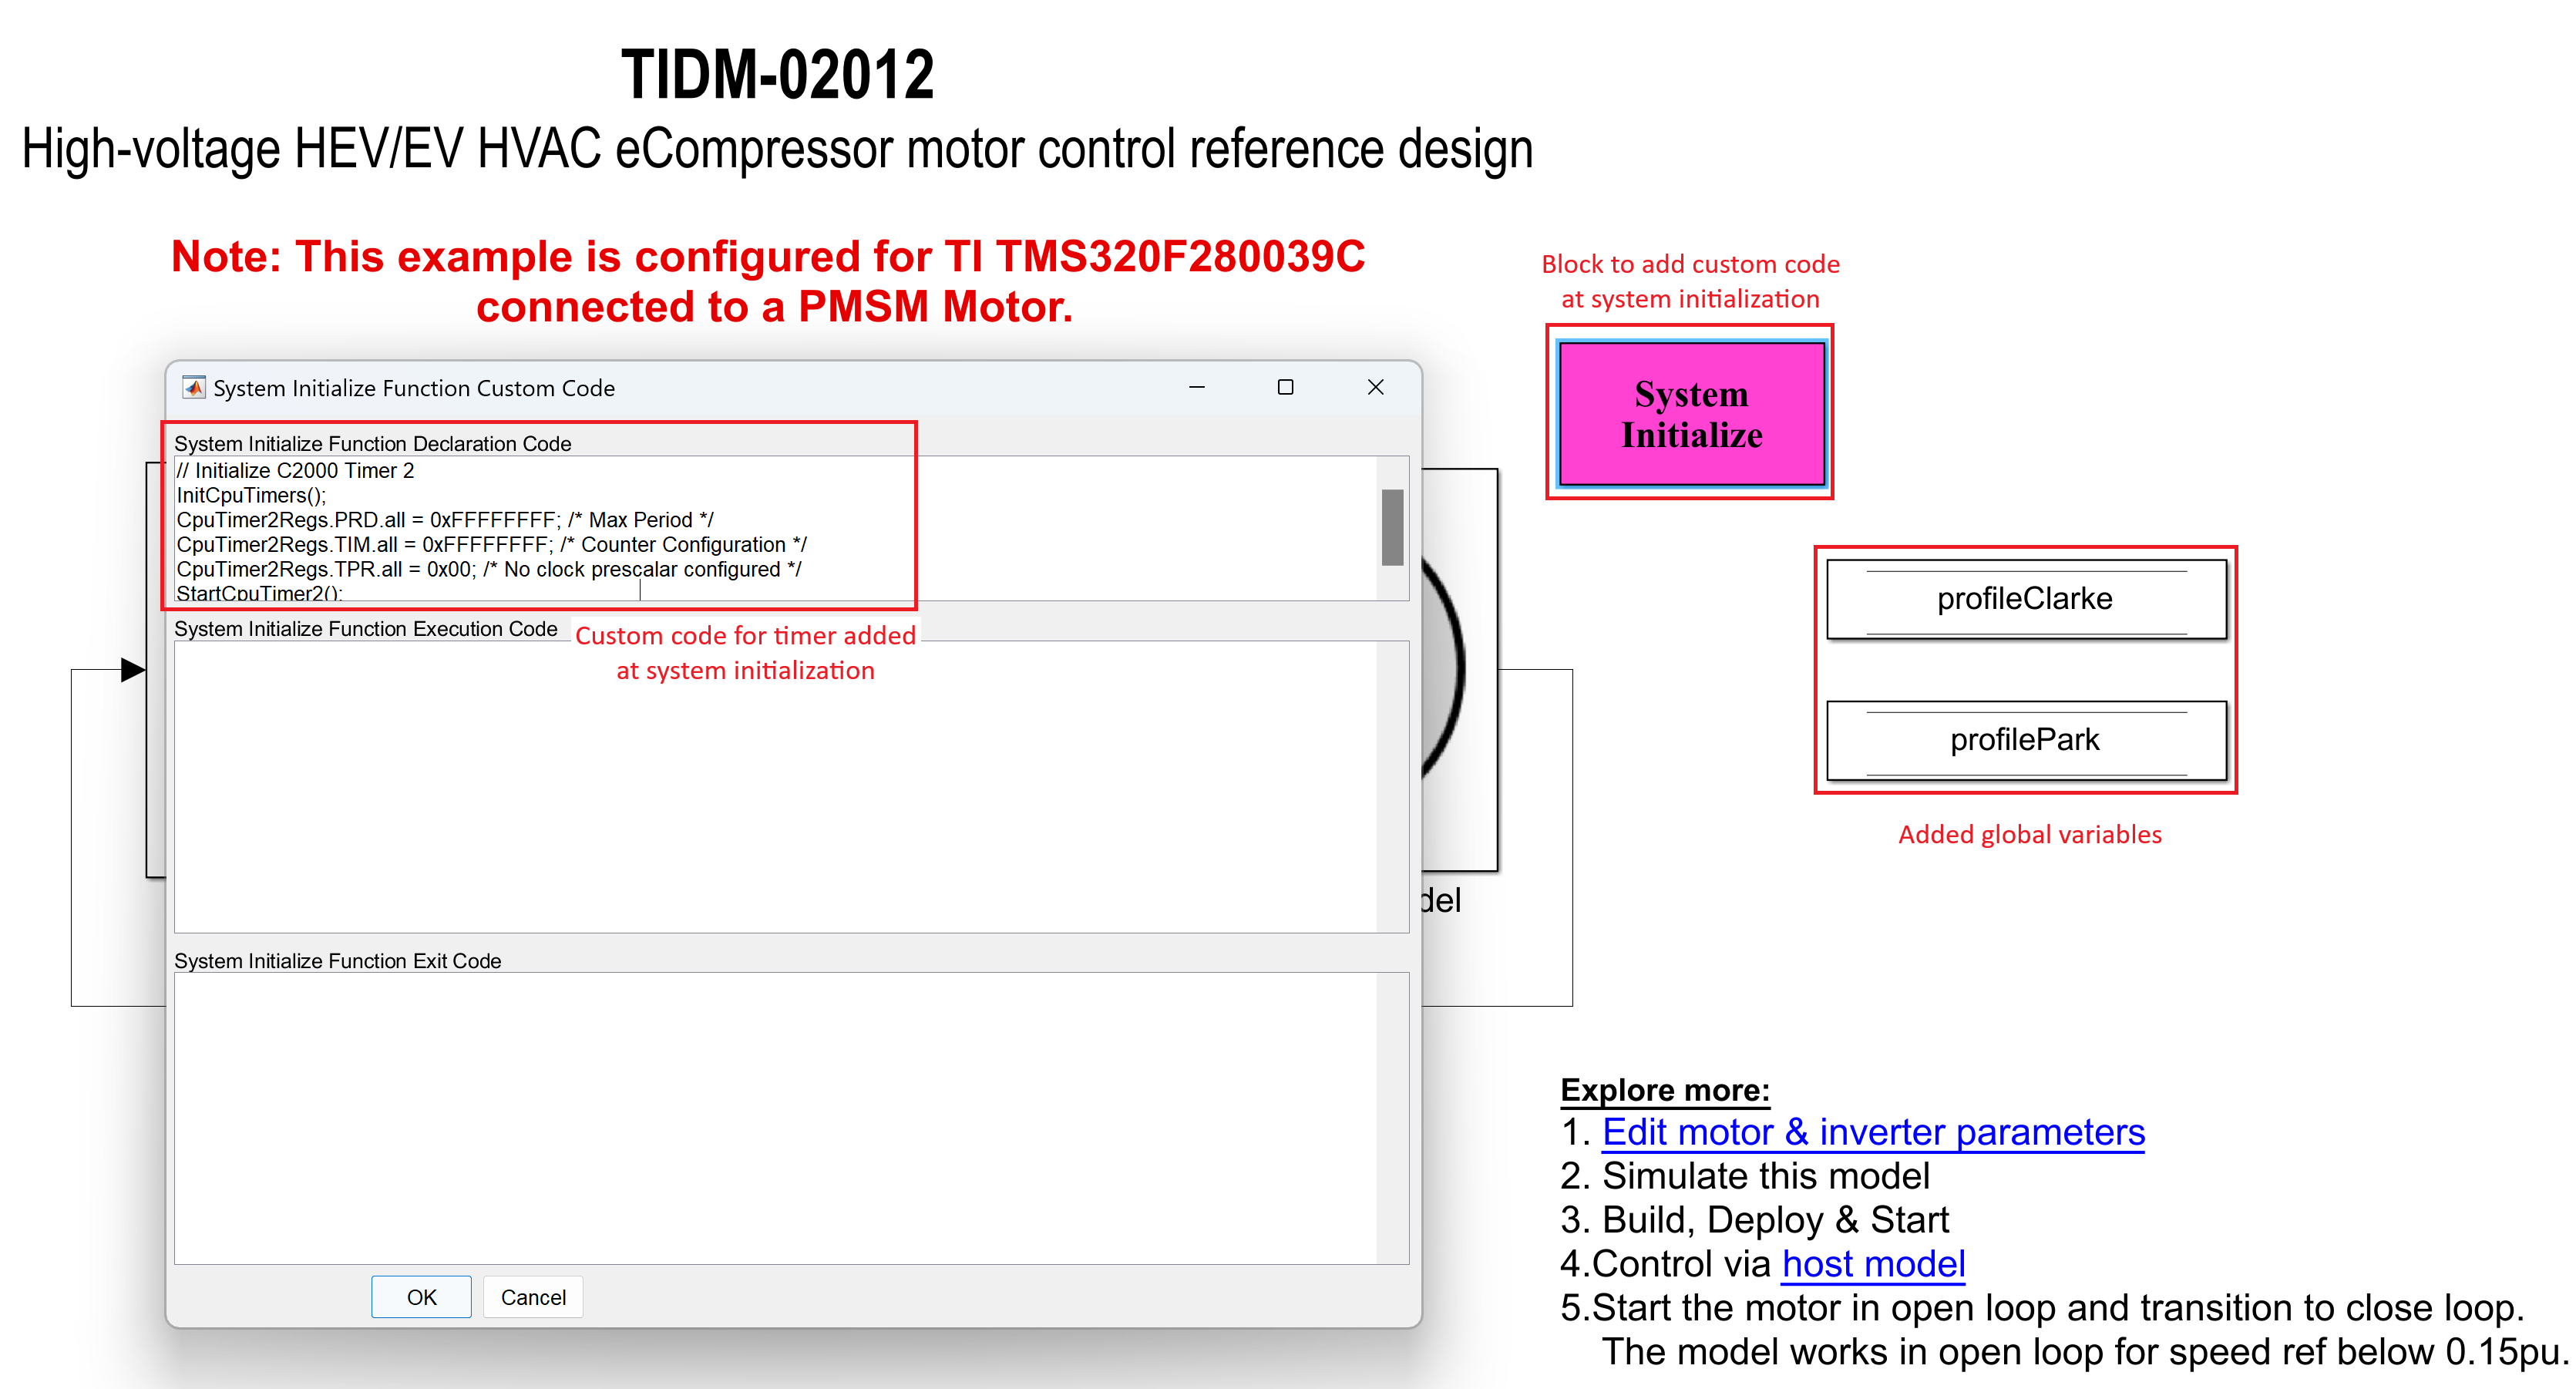
At the top level of the model, add the System Initialize block available in the Simulink library under Simulink Coder > Custom Code. This block contains the timer initialization code.
 Figure 4-4 Timer Initialization Code
// Initialize C2000 Timer 2
InitCpuTimers();
CpuTimer2Regs.PRD.all = 0xFFFFFFFF; /* Max Period */
CpuTimer2Regs.TIM.all = 0xFFFFFFFF; /* Counter Configuration */
CpuTimer2Regs.TPR.all = 0x00; /* No clock prescalar configured */
StartCpuTimer2();
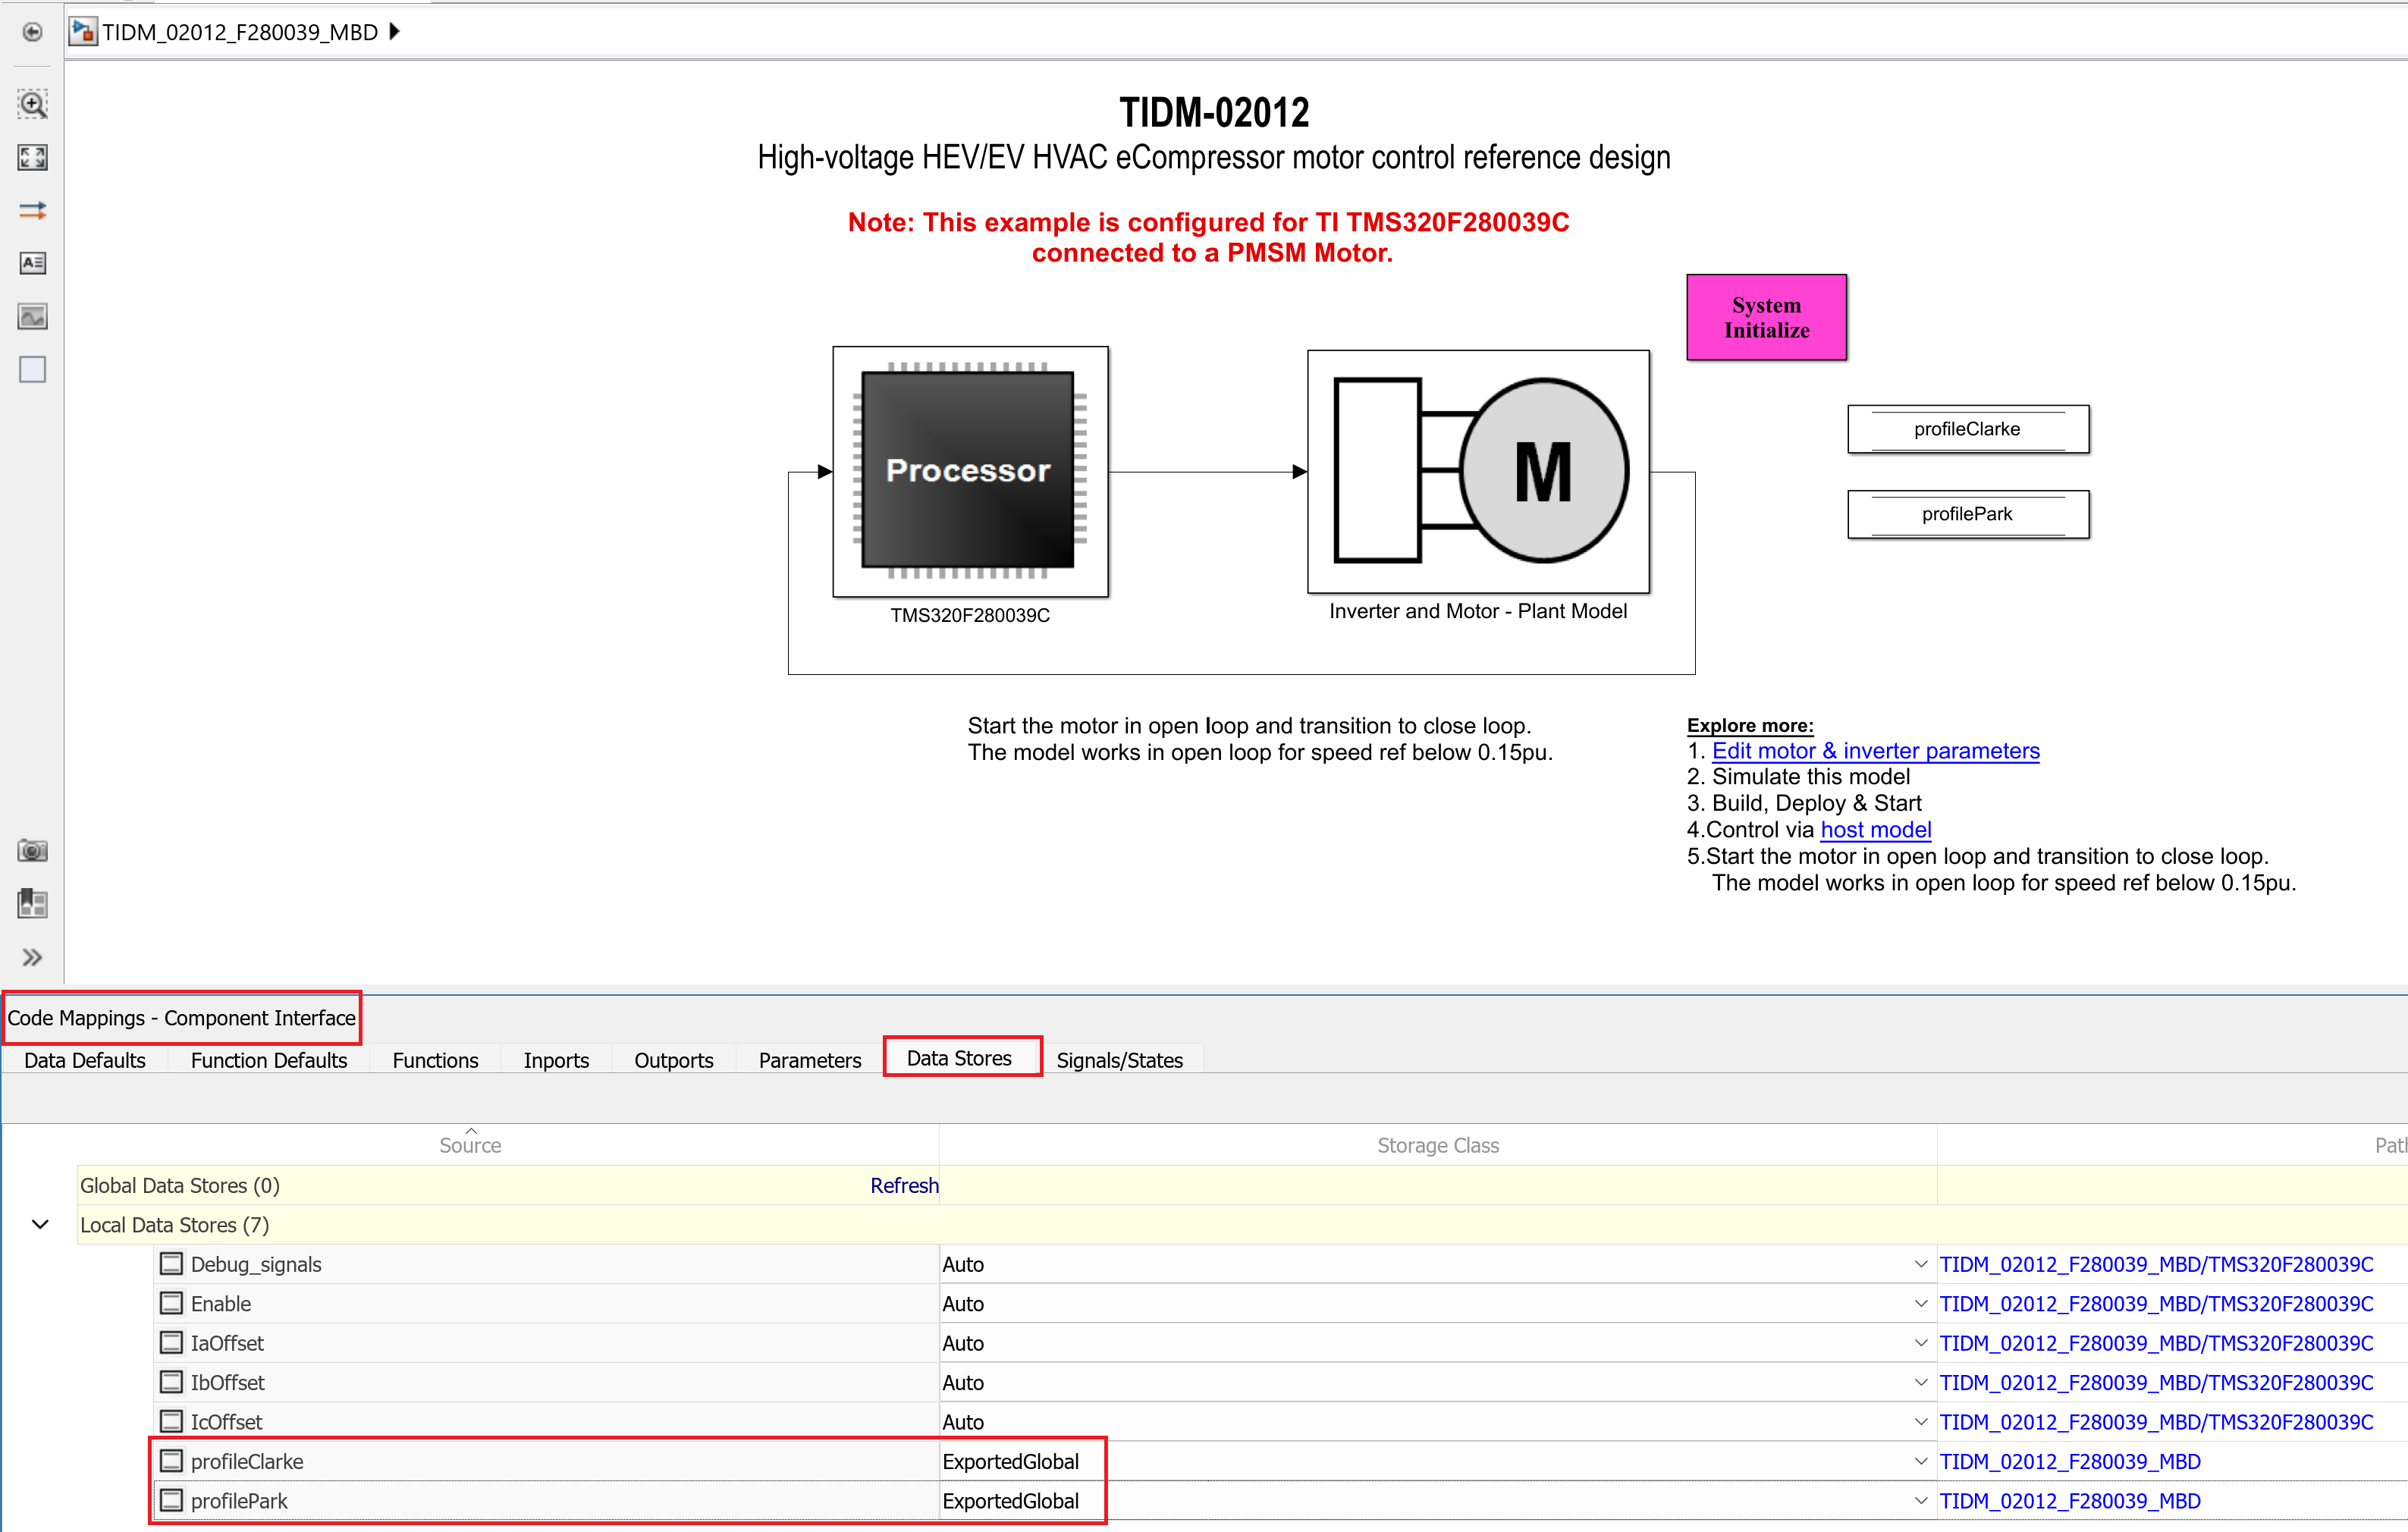
Add Data Store Memory blocks to the top level along with System initialize block for the blocks that need to be profiled. Name the Data Store Memory blocks appropriately as shown in Figure 4-5. Open the Embedded Coder application from the APPS menu. Select Code Mappings > Component Interface, navigate to Data Stores tab. Change the storage class of variables created using Data Store Memory blocks to ExportedGlobal.
 Figure 4-5 Storage Class for Variable
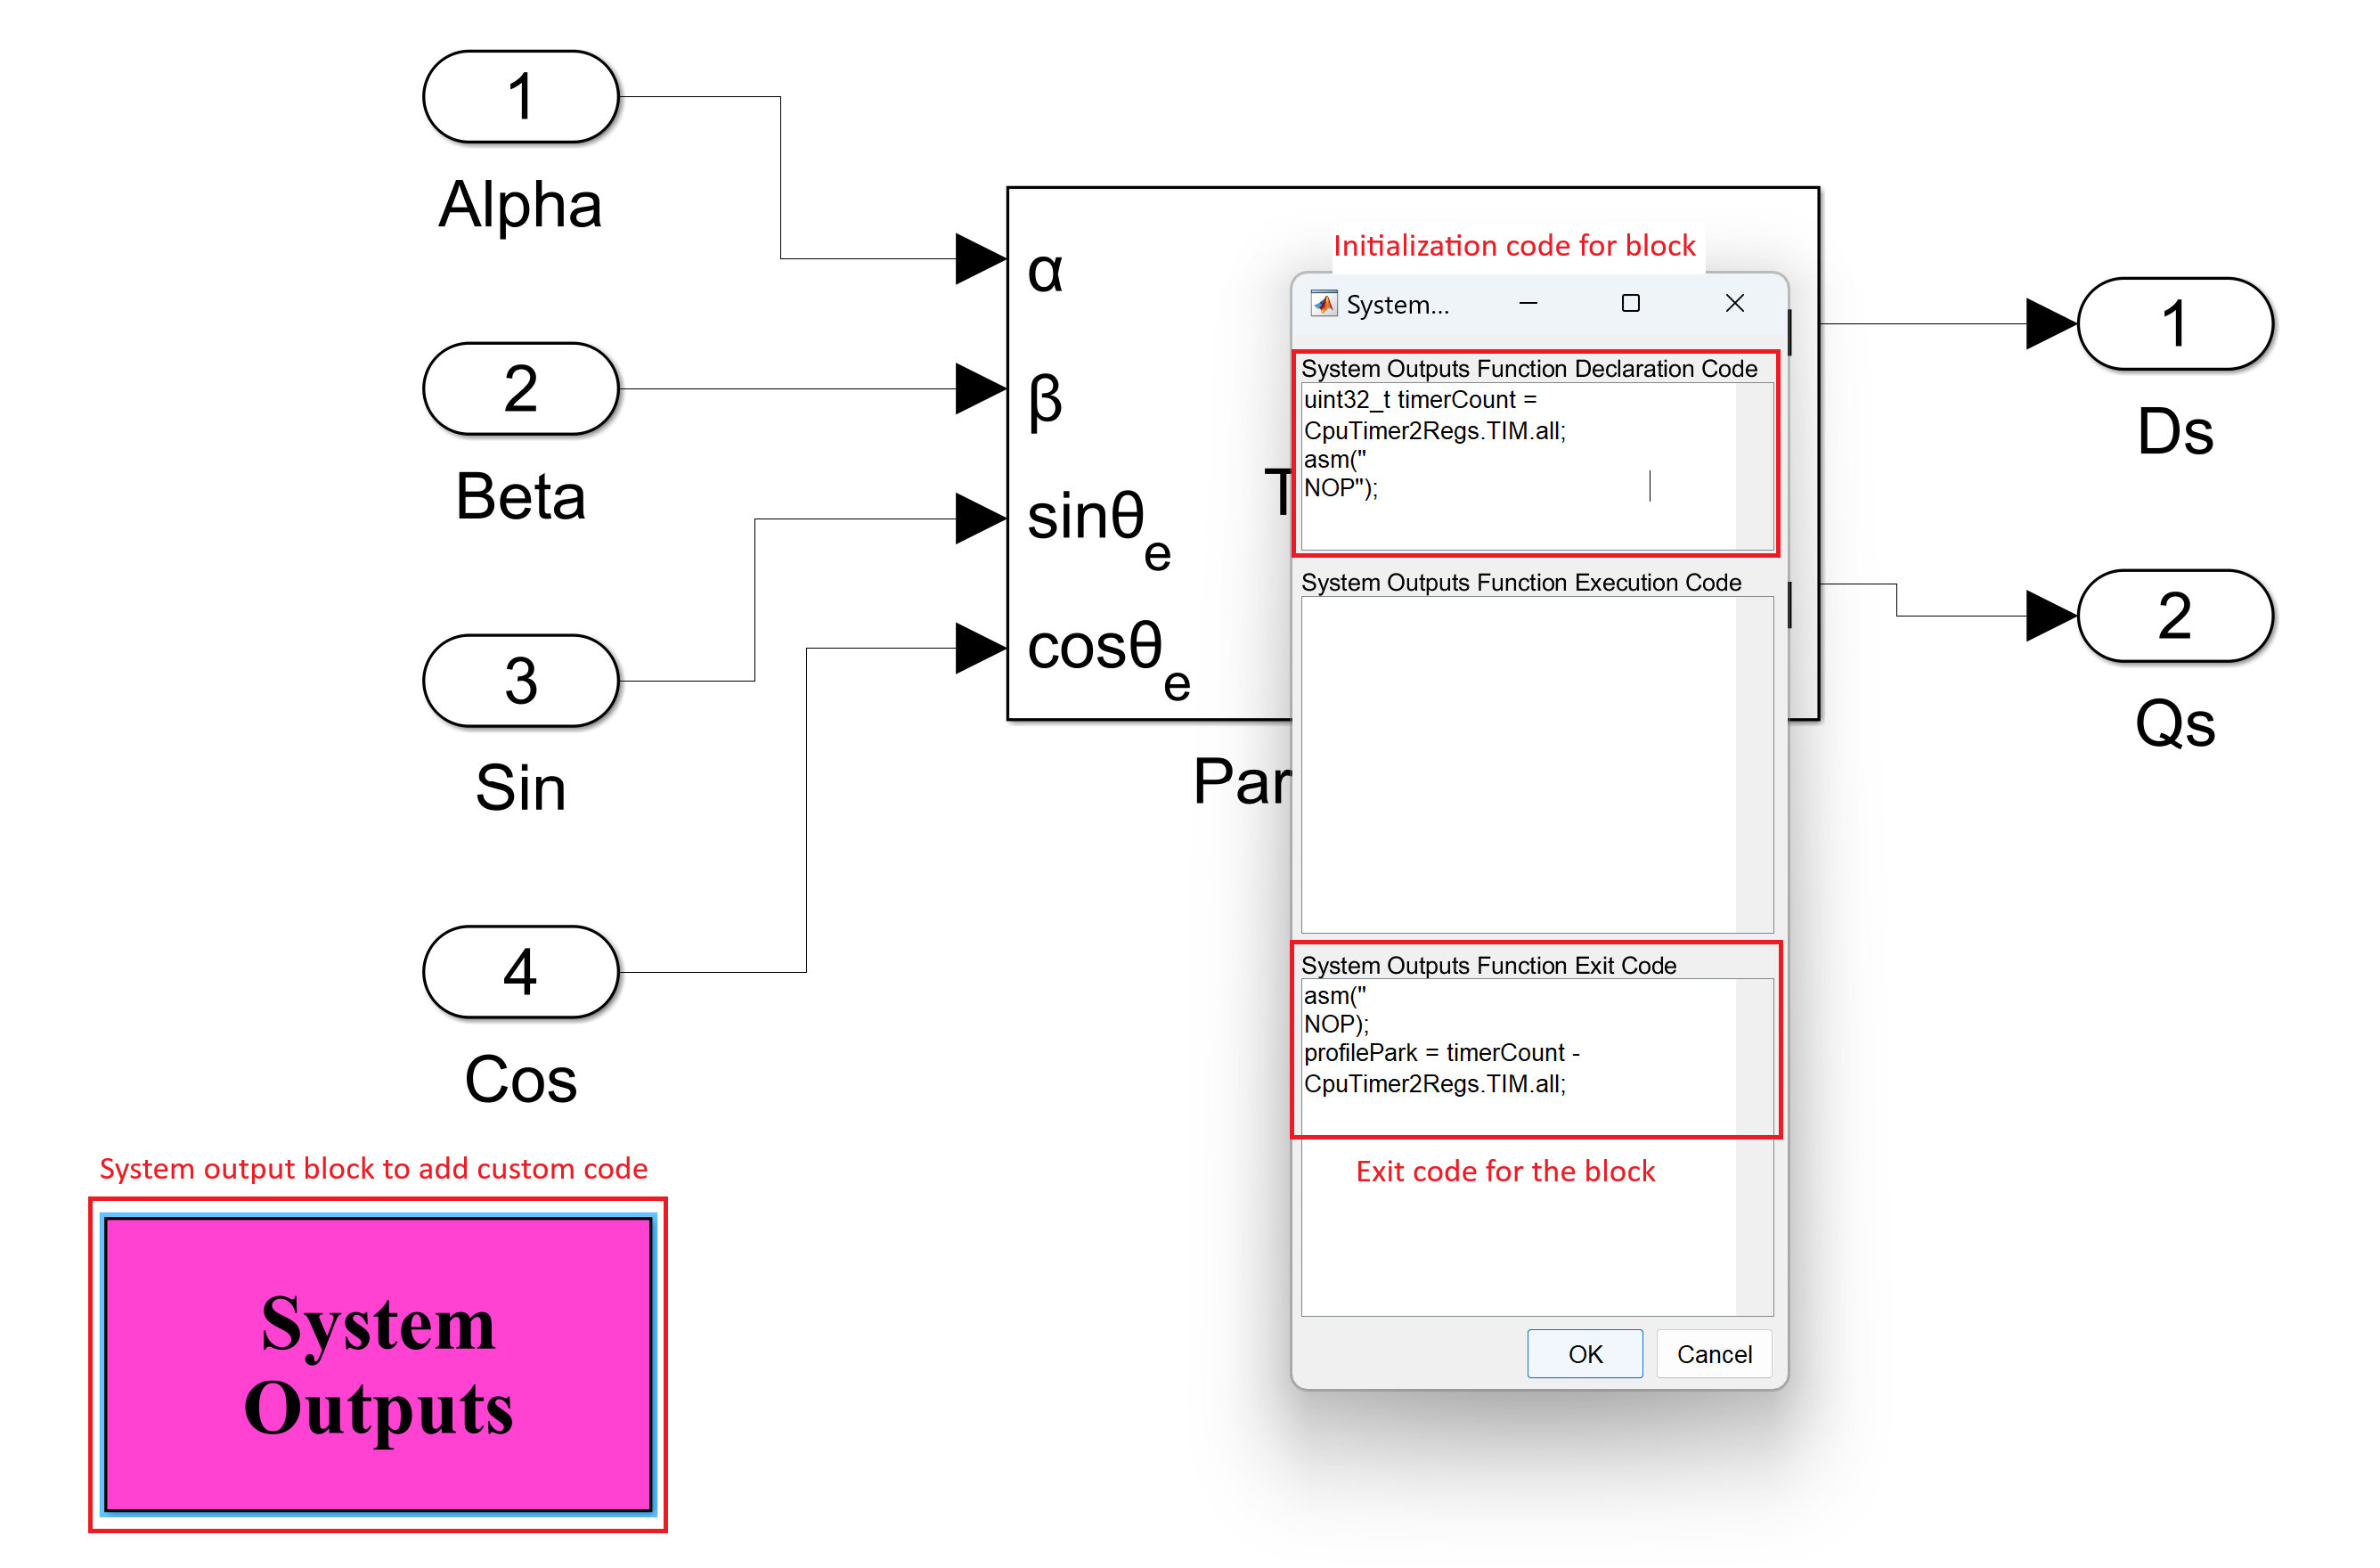
Now, within the subsystem to be profiled, add a System Outputs block from the Simulink library. If it is a standalone block, for example, park transform block, then the block can be made a subsystem after which the System Outputs block can be added. In the System Outputs block, add the read timer value code and store in a temporary variable in the Function Declaration Code section and read the timer value again in the Function Exit Code section. Compute the difference in the exit code section and store the value in global variable defined earlier as shown in the code block.
 Figure 4-6 System Outputs Timer Code
To profile a block, once the subsystem is created, right click on it and navigate to Block Parameters(subsystem). Check the treat as atomic unit checkbox. Build the model and load the generated .out file in the device using CCS. Add the added global variables in the expressions window of CCS to watch and run the code. Open the host control model, select the appropriate COM port and set the desired speed. Run the motor, using the toggle switch to start the motor. This sends an enable PWM signal to the device to run the algorithm, after which the variables in the watch window are updated with the cycle count. Observe the variation in the variables using the Continuous refresh option in the expressions window.
/* Code block for System Output Function Declaration Code */
uint32_T timerCount1 = CpuTimer2Regs.TIM.all;
asm(" NOP");

/* Code block for System Output Function Exit Code */
asm(" NOP");
profilePark=  timerCount1 - CpuTimer2Regs.TIM.all;
To remove the timer measurement overhead, a separate block of code can be added in any of the blocks with the code mentioned in the block below. The idea to calculate the timer overhead is to do a back to back timer read and difference between the reads will be the overhead. On execution of the code block, the overhead can be quantified and subtracted out from the profiling data that is calculated for the other blocks. It is to be noted that, similar to the global variables defined previously for each of the blocks, the variable corresponding to timer overhead also has to be added.
/* Code block for calculation of timer overhead */
uint32_T overheadCount = CpuTimer2Regs.TIM.all;
asm(" NOP");

/* Code block for System Output Function Exit Code */
asm(" NOP");
profileOverhead=  overheadCount - CpuTimer2Regs.TIM.all;
Other than C2000 timer-based profiling, GPIO-based profiling method can also be used if an oscilloscope is available. It is to be noted that GPIO-based profiling needs external scope to view the waveform and measure the timings. Instead of the timer reads as discussed in this section, the GPIO can be toggled at the start and end of the routine, which needs to be profiled. The overhead in the GPIO-based profiling method is limited to the time taken to write to the GPIO registers.