SPRUHJ1I January 2013 – October 2021 TMS320F2802-Q1 , TMS320F28026-Q1 , TMS320F28026F , TMS320F28027-Q1 , TMS320F28027F , TMS320F28027F-Q1 , TMS320F28052-Q1 , TMS320F28052F , TMS320F28052F-Q1 , TMS320F28052M , TMS320F28052M-Q1 , TMS320F28054-Q1 , TMS320F28054F , TMS320F28054F-Q1 , TMS320F28054M , TMS320F28054M-Q1 , TMS320F2806-Q1 , TMS320F28062-Q1 , TMS320F28062F , TMS320F28062F-Q1 , TMS320F28068F , TMS320F28068M , TMS320F28069-Q1 , TMS320F28069F , TMS320F28069F-Q1 , TMS320F28069M , TMS320F28069M-Q1
- 1 Read This First
-
1 Introduction
- 1.1 An Overview of InstaSPIN-FOC™ and FAST™
- 1.2
An Overview of InstaSPIN-MOTION™ and SpinTAC™
- 1.2.1 InstaSPIN-MOTION™ Key Capabilities and Benefits
- 1.2.2 InstaSPIN-MOTION™ Block Diagrams
- 1.2.3 Application Examples
- 2 Quick Start Kits - TI Provided Software and Hardware
-
3 InstaSPIN™ and MotorWare™
- 3.1 Overview
- 3.2 MotorWare™ Directory Structure
- 3.3 MotorWare™ Object-Oriented Design
- 3.4
InstaSPIN-FOC™ API
- 3.4.1
Controller API Functions – ctrl.c, ctrl.h,
CTRL_obj.h
- 3.4.1.1 CTRL Enumerations and Structures
- 3.4.1.2 CTRL State Control and Error Handling
- 3.4.1.3
CTRL Get Functions
- CTRL_getCount_current ()
- CTRL_getCount_isr ()
- CTRL_getCount_speed ()
- CTRL_getCount_state ()
- CTRL_getCount_traj ()
- CTRL_getCtrlFreq ()
- CTRL_getCtrlPeriod_sec ()
- CTRL_getErrorCode ()
- CTRL_getEstHandle ()
- CTRL_getFlag_enableCtrl ()
- CTRL_getFlag_enableDcBusComp ()
- CTRL_getFlag_enablePowerWarp ()
- CTR CTRL_getFlag_enableOffset ()
- CTRL_getFlag_enableSpeedCtrl ()
- CTRL_getFlag_enableUserMotorParams ()
- CTRL_getGains ()
- CTRL_getIab_filt_pu ()
- CTRL_getIab_filt_addr ()
- CTRL_getIab_in_addr ()
- CTRL_getIab_in_pu ()
- CTRL_getId_in_pu ()
- CTRL_getId_ref_pu ()
- CTRL_getIdq_in_addr ()
- CTRL_getIdq_in_pu ()
- CTRL_getIdq_ref_pu ()
- CTRL_getIdRated_pu ()
- CTRL_getIq_in_pu ()
- CTRL_getIq_ref_pu ()
- CTRL_getKi ()
- CTRL_getKd ()
- CTRL_getKp ()
- CTRL_getLhf ()
- CTRL_getMagCurrent_pu ()
- CTRL_getMaxVsMag_pu ()
- CTRL_getMaximumSpeed_pu ()
- CTRL_getMotorRatedFlux ()
- CTRL_getMotorType ()
- CTRL_getNumCtrlTicksPerCurrentTick ()
- CTRL_getNumCtrlTicksPerSpeedTick ()
- CTRL_getNumCtrlTicksPerTrajTick ()
- CTRL_getNumIsrTicksPerCtrlTick ()
- CTRL_getRefValue_pu ()
- CTRL_getRhf ()
- CTRL_getRoverL ()
- CTRL_getSpd_max_pu ()
- CTRL_getSpd_out_addr ()
- CTRL_getSpd_out_pu ()
- CTRL_getSpd_ref_pu ()
- CTRL_getSpd_int_ref_pu ()
- CTRL_getState ()
- CTRL_getTrajFreq ()
- CTRL_getTrajPeriod_sec ()
- CTRL_getTrajStep ()
- CTRL_getUi ()
- CTRL_getVab_in_pu ()
- CTRL_getVab_out_addr ()
- CTRL_getVab_out_pu ()
- CTRL_getVd_out_addr ()
- CTRL_getVd_out_pu ()
- CTRL_getVdq_out_addr ()
- CTRL_getVdq_out_pu ()
- CTRL_getVersion ()
- CTRL_getVq_out_addr ()
- CTRL_getVq_out_pu ()
- CTRL_getWaitTime ()
- 3.4.1.4 CTRL Counter Functions
- 3.4.1.5
CTRL Set Functions
- CTRL_setCtrlFreq_Hz ()
- CTRL_setCtrlFreq_sec ()
- CTRL_setErrorCode ()
- CTRL_setEstParams ()
- CTRL_setFlag_enableCtrl ()
- CTRL_setFlag_enableDcBusComp ()
- CTRL_setFlag_enablePowerWarp ()
- CTRL_setFlag_enableOffset ()
- calibrationCTRL_setFlag_enableSpeedCtrl ()
- CTRL_setFlag_enableUserMotorParams ()
- CTRL_setGains ()
- CTRL_setIab_in_pu ()
- CTRL_setIab_filt_pu ()
- CTRL_setId_ref_pu ()
- CTRL_setIdq_in_pu ()
- CTRL_setIdq_ref_pu ()
- CTRL_setIdRated_pu ()
- CTRL_setIq_ref_pu ()
- CTRL_setKd ()
- CTRL_setKi ()
- CTRL_setKp ()
- CTRL_setLhf ()
- CTRL_setMagCurrent_pu ()
- CTRL_setMaxVsMag_pu ()
- CTRL_setMaxAccel_pu ()
- CTRL_setMaximumSpeed_pu ()
- CTRL_setParams()
- CTRL_setNumCtrlTicksPerCurrentTick ()
- CTRL_setNumCtrlTicksPerSpeedTick ()
- CTRL_setNumCtrlTicksPerTrajTick ()
- CTRL_setNumIsrTicksPerCtrlTick ()
- CTRL_setRhf ()
- CTRL_setRoverL ()
- CTRL_setSpdMax ()
- CTRL_setSpd_max_pu ()
- CTRL_setSpd_out_pu ()
- CTRL_setSpd_ref_pu ()
- CTRL_setSpd_ref_krpm ()
- CTRL_setState ()
- CTRL_setTrajFreq_Hz ()
- CTRL_setTrajPeriod_sec ()
- CTRL_setUi ()
- CTRL_setupClarke_I ()
- CTRL_setupClarke_V ()
- CTRL_setupEstIdleState ()
- CTRL_setupEstOnLineState ()
- CTRL_setUserMotorParams ()
- CTRL_setVab_in_pu ()
- CTRL_setVab_out_pu ()
- CTRL_setVdq_out_pu ()
- CTRL_setWaitTimes ()
- CTRL_setup ()
- CTRL_setupCtrl ()
- CTRL_setupEst ()
- CTRL_setupTraj ()
- 3.4.1.6 CTRL Run and Compute Functions
- 3.4.2
Estimator API Functions – FAST™ Library – est.h,
est_states.h
- 3.4.2.1 EST Enumerations and Structures
- 3.4.2.2
EST Set Functions
- EST_setRsOnLineId_pu ()
- EST_setAngle_pu ()
- EST_setDcBus_pu ()
- EST_setDir_qFmt ()
- EST_setFe_neg_max_pu ()
- EST_setFe_pos_min_pu ()
- EST_setFlag_enableFluxControl ()
- EST_setFlag_enableForceAngle ()
- EST_setFlag_enableRsOnLine ()
- EST_setFlag_enableRsRecalc ()
- EST_setFlag_estComplete ()
- EST_setFlag_updateRs ()
- EST_setForceAngleDelta_pu ()
- EST_setFreqB0_lp_pu ()
- EST_setFreqBeta_lp_pu ()
- EST_setFullScaleCurrent ()
- EST_setFullScaleFlux ()
- EST_setFullScaleFreq ()
- EST_setFullScaleInductance ()
- EST_setFullScaleResistance ()
- EST_setFullScaleVoltage ()
- EST_setIdle ()
- EST_setIdle_all ()
- EST_setId_ref_pu ()
- EST_setIdRated_pu ()
- EST_setIq_ref_pu ()
- EST_setLs_d_pu ()
- EST_setLs_delta_pu ()
- EST_setLs_dq_pu ()
- EST_setLs_q_pu ()
- EST_setLs_qFmt ()
- EST_setMaxAccel_pu ()
- EST_setMaxAccel_est_pu ()
- EST_setMaxCurrentSlope_pu ()
- EST_setMaxCurrentSlope_PowerWarp_pu ()
- EST_setRr_pu ()
- EST_setRr_qFmt ()
- EST_setRs_delta_pu ()
- EST_setRsOnLine_pu ()
- EST_setRsOnLine_qFmt ()
- EST_setRsOnLineFilterParams ()
- EST_setRsOnLineId_mag_pu ()
- EST_setRs_pu ()
- EST_setRs_qFmt ()
- EST_updateId_ref_pu ()
- 3.4.2.3
EST Get Functions
- EST_get_krpm_to_pu_sf ()
- EST_get_pu_to_krpm_sf ()
- EST_getAngle_pu ()
- EST_getDcBus_pu ()
- EST_ErrorCode_e EST_getErrorCode ()
- EST_getFe ()
- EST_getFe_pu ()
- EST_getFlag_enableForceAngle ()
- EST_getFlag_enableRsOnLine ()
- EST_getFlag_enableRsRecalc ()
- EST_getFlag_estComplete ()
- EST_getFlag_updateRs ()
- EST_getFlux_VpHz ()
- EST_getFlux_Wb ()
- EST_getFlux_pu ()
- EST_getFm ()
- EST_getFm_pu ()
- EST_getForceAngleDelta_pu ()
- EST_getForceAngleStatus ()
- EST_getFreqB0_lp_pu ()
- EST_getFreqBeta_lp_pu ()
- EST_getFslip ()
- 280
- EST_getFslip_pu ()
- EST_getFullScaleCurrent ()
- EST_getFullScaleFlux ()
- EST_getFullScaleFreq ()
- EST_getFullScaleInductance ()
- EST_getFullScaleResistance ()
- EST_getFullScaleVoltage ()
- EST_getIdRated ()
- EST_getIdRated_pu ()
- EST_getIdRated_indEst_pu ()
- EST_getIdRated_ratedFlux_pu ()
- EST_getLr_H ()
- EST_getLr_pu ()
- EST_getLr_qFmt ()
- EST_getLs_d_H ()
- EST_getLs_d_pu ()
- EST_getLs_delta_pu ()
- EST_getLs_dq_pu ()
- EST_getLs_q_H ()
- EST_getLs_q_pu ()
- EST_getLs_qFmt ()
- EST_getLs_max_pu ()
- EST_getLs_min_pu ()
- EST_getLs_coarse_max_pu ()
- EST_getMaxAccel_pu ()
- EST_getMaxAccel_est_pu ()
- EST_getMaxCurrentSlope_pu ()
- EST_getMaxCurrentSlope_PowerWarp_pu ()
- EST_getOneOverDcBus_pu ()
- EST_getRr_Ohm ()
- EST_getRr_pu ()
- EST_getRr_qFmt ()
- EST_getRs_delta_pu ()
- EST_getRs_Ohm ()
- EST_getRs_pu ()
- EST_getRs_qFmt ()
- EST_getRs_qFmt ()
- EST_getRsOnLine_Ohm ()
- EST_getRsOnLine_pu ()
- EST_getRsOnLineId_mag_pu ()
- EST_getRsOnLineId_pu ()
- EST_getSpeed_krpm ()
- EST_getSignOfDirection ()
- EST_getSpeed_krpm ()
- EST_getState ()
- EST_getTorque_lbin ()
- EST_getTorque_Nm ()
- EST_getDir_qFmt ()
- 3.4.2.4 EST Run and Compute Functions
- 3.4.2.5 EST Counter Functions
- 3.4.2.6 EST State Control and Error Handling Functions
- 3.4.3
Hardware Abstraction Layer (HAL) API Functions – hal.c, hal.h, hal_obj.h
- 3.4.3.1 HAL Enumerations and Structures
- 3.4.3.2
HAL – ADC and AFE
- HAL_setupAdcs ()
- HAL_setupAfe ()
- HAL_acqAdcInt ()
- HAL_readAdcData()
- HAL_updateAdcBias ()
- HAL_setBias ()
- HAL_getBias ()
- HAL_cal ()
- HAL_AdcCalConversion ()
- HAL_AdcOffsetSelfCal ()
- HAL_getAdcSocSampleDelay ()
- HAL_setAdcSocSampleDelay ()
- HAL_getCurrentScaleFactor ()
- HAL_setCurrentScaleFactor ()
- HAL_getVoltageScaleFactor ()
- HAL_setVoltageScaleFactor ()
- HAL_getNumCurrentSensors ()
- HAL_setNumCurrentSensors ()
- HAL_getNumVoltageSensors ()
- HAL_setNumVoltageSensors ()
- 377
- HAL_getOffsetBeta_lp_pu ()
- HAL_setOffsetBeta_lp_pu ()
- HAL_setOffsetInitCond ()
- HAL_getOffsetValue ()
- HAL_setOffsetValue ()
- HAL_runOffsetEst ()
- 3.4.3.3 HAL – PWM and PWM-DAC
- 3.4.3.4 HAL – CPU Timers
- 3.4.3.5 HAL – GPIO and LED
- 3.4.3.6
HAL – Miscellaneous
- HAL_init()
- HAL_initIntVectorTable ()
- HAL_setParams ()
- HAL_setupFlash ()
- HAL_setupPie ()
- HAL_setupPll ()
- HAL_setupPeripheralClks ()
- HAL_getOscTrimValue ()
- HAL_OscTempComp ()
- HAL_osc1Comp ()
- HAL_osc2Comp ()
- HAL_setupFaults ()
- HAL_setParams()
- HAL_enableDebugInt ()
- HAL_enableGlobalInts ()
- HAL_disableGlobalInts ()
- HAL_disableWdog ()
- 3.4.4 User Settings – user.c, user.h, userParams.h
- 3.4.5 Miscellaneous Functions
- 3.4.1
Controller API Functions – ctrl.c, ctrl.h,
CTRL_obj.h
- 3.5 InstaSPIN-MOTION™ and the SpinTAC™ API
- 3.6 SpinTAC™ API
-
4 User Parameters (user.h)
- 4.1
Currents and Voltages
- 4.1.1 USER_IQ_FULL_SCALE_FREQ_Hz
- 4.1.2 USER_IQ_FULL_SCALE_VOLTAGE_V
- 4.1.3 USER_ADC_FULL_SCALE_VOLTAGE_V
- 4.1.4 USER_VOLTAGE_SF
- 4.1.5 USER_IQ_FULL_SCALE_CURRENT_A
- 4.1.6 USER_ADC_FULL_SCALE_CURRENT_A
- 4.1.7 USER_CURRENT_SF
- 4.1.8 USER_NUM_CURRENT_SENSORS
- 4.1.9 USER_NUM_VOLTAGE_SENSORS
- 4.1.10 I_A_offset , I_B_offset , I_C_offset
- 4.1.11 V_A_offset , V_B_offset , V_C_offset
- 4.2 Clocks and Timers
- 4.3
Decimation
- 4.3.1 USER_NUM_PWM_TICKS_PER_ISR_TICK
- 4.3.2 USER_NUM_ISR_TICKS_PER_CTRL_TICK
- 4.3.3 USER_NUM_CTRL_TICKS_PER_CURRENT_TICK
- 4.3.4 USER_NUM_CTRL_TICKS_PER_EST_TICK
- 4.3.5 USER_NUM_CTRL_TICKS_PER_SPEED_TICK
- 4.3.6 USER_NUM_CTRL_TICKS_PER_TRAJ_TICK
- 4.3.7 USER_CTRL_FREQ_Hz
- 4.3.8 USER_EST_FREQ_Hz
- 4.3.9 USER_TRAJ_FREQ_Hz
- 4.3.10 USER_CTRL_PERIOD_usec
- 4.3.11 USER_CTRL_PERIOD_sec
- 4.4
Limits
- 4.4.1 USER_MAX_NEGATIVE_ID_REF_CURRENT_A
- 4.4.2 USER_ZEROSPEEDLIMIT
- 4.4.3 USER_FORCE_ANGLE_FREQ_Hz
- 4.4.4 USER_MAX_CURRENT_SLOPE_POWERWARP
- 4.4.5 USER_MAX_ACCEL_Hzps
- 4.4.6 USER_MAX_ACCEL_EST_Hzps
- 4.4.7 USER_MAX_CURRENT_SLOPE
- 4.4.8 USER_IDRATED_FRACTION_FOR_RATED_FLUX
- 4.4.9 USER_IDRATED_FRACTION_FOR_L_IDENT
- 4.4.10 USER_IDRATED_DELTA
- 4.4.11 USER_SPEEDMAX_FRACTION_FOR_L_IDENT
- 4.4.12 USER_FLUX_FRACTION
- 4.4.13 USER_POWERWARP_GAIN
- 4.4.14 USER_R_OVER_L_EST_FREQ_Hz
- 4.5 Poles
- 4.6
User Motor and ID Settings
- 4.6.1 USER_MOTOR_TYPE
- 4.6.2 USER_MOTOR_NUM_POLE_PAIRS
- 4.6.3 USER_MOTOR_Rr
- 4.6.4 USER_MOTOR_Rs
- 4.6.5 USER_MOTOR_Ls_d
- 4.6.6 USER_MOTOR_Ls_q
- 4.6.7 USER_MOTOR_RATED_FLUX
- 4.6.8 USER_MOTOR_MAGNETIZING_CURRENT
- 4.6.9 USER_MOTOR_RES_EST_CURRENT
- 4.6.10 USER_MOTOR_IND_EST_CURRENT
- 4.6.11 USER_MOTOR_MAX_CURRENT
- 4.6.12 USER_MOTOR_FLUX_EST_FREQ_Hz
- 4.6.13 USER_MOTOR_ENCODER_LINES (InstaSPIN-MOTION™ Only)
- 4.6.14 USER_MOTOR_MAX_SPEED_KRPM (InstaSPIN-MOTION™ Only)
- 4.6.15 USER_SYSTEM_INERTIA (InstaSPIN-MOTION™ Only)
- 4.6.16 USER_SYSTEM_FRICTION (InstaSPIN-MOTION™ Only)
- 4.6.17 USER_SYSTEM_BANDWIDTH_SCALE (InstaSPIN-MOTION™ Only)
- 4.7
SpinTAC™ Parameters (spintac_velocity.h and
spintac_position.h)
- 4.7.1
Macro Definitions
- 4.7.1.1 ST_MREV_ROLLOVER (spintac_position.h only)
- 4.7.1.2 ST_EREV_MAXIMUM (spintac_position.h only)
- 4.7.1.3 ST_POS_ERROR_MAXIMUM_MREV (spintac_position.h only)
- 4.7.1.4 ST_ISR_TICKS_PER_SPINTAC_TICK
- 4.7.1.5 ST_SPEED_SAMPLE_TIME
- 4.7.1.6 ST_SPEED_PU_PER_KRPM
- 4.7.1.7 ST_SPEED_KRPM_PER_PU
- 4.7.1.8 ST_MOTOR_INERTIA_PU
- 4.7.1.9 ST_MOTOR_FRICTION_PU
- 4.7.1.10 ST_MIN_ID_SPEED_RPM
- 4.7.1.11 ST_MIN_ID_SPEED_PU
- 4.7.1.12 ST_ID_INCOMPLETE_ERROR
- 4.7.1.13 ST_VARS_DEFAULTS
- 4.7.2 Type Definitions
- 4.7.3
Functions
- 4.7.3.1 ST_init
- 4.7.3.2 ST_setupPosConv
- 4.7.3.3 ST_setupVelCtl (Velocity Control Only)
- 4.7.3.4 ST_setupPosCtl (Position Control Only)
- 4.7.3.5 ST_setupVelMove (Velocity Control Only)
- 4.7.3.6 ST_setupPosMove (Position Control Only)
- 4.7.3.7 ST_setupVelPlan (Velocity Control Only)
- 4.7.3.8 ST_setupPosPlan (Position Control Only)
- 4.7.3.9 ST_setupVelId (Velocity Control Only)
- 4.7.3.10 ST_runPosConv
- 4.7.3.11 ST_runVelCtl (Velocity Control Only)
- 4.7.3.12 ST_runPosCtl (Position Control Only)
- 4.7.3.13 ST_runVelMove (Velocity Control Only)
- 4.7.3.14 ST_runPosMove (Position Control Only)
- 4.7.3.15 ST_runVelPlan (Velocity Control Only)
- 4.7.3.16 ST_runVelPlanTick (Velocity Control Only)
- 4.7.3.17 ST_runPosPlan (Position Control Only)
- 4.7.3.18 ST_runPosPlanTick (Position Control Only)
- 4.7.3.19 ST_runVelId (Velocity Control Only)
- 4.7.1
Macro Definitions
- 4.8 Setting ACIM Motor Parameters in user.h
- 4.1
Currents and Voltages
- 5 Managing Motor Signals
-
6 Motor Identification and State Diagrams
- 6.1 Overview
- 6.2 InstaSPIN™ Motor Identification
- 6.3 Motor Identification Process Overview
- 6.4 Differences between PMSM and ACIM Identification Process
- 6.5 Prerequisites
- 6.6
Full Identification of PMSM Motors
- 6.6.1 CTRL_State_Idle and EST_State_Idle
- 6.6.2 CTRL_State_OffLine and EST_State_Idle (Hardware Offsets Calibrated)
- 6.6.3 CTRL_State_OnLine and EST_State_RoverL
- 6.6.4 CTRL_State_OnLine and EST_State_Rs
- 6.6.5 CTRL_State_OnLine and EST_State_RampUp
- 6.6.6 CTRL_State_OnLine and EST_State_RatedFlux
- 6.6.7 CTRL_State_OnLine and EST_State_Ls
- 6.6.8 CTRL_State_OnLine and EST_State_RampDown
- 6.6.9 CTRL_State_OnLine and EST_State_MotorIdentified
- 6.6.10 CTRL_State_Idle and EST_State_Idle
- 6.7
Full Identification of ACIM Motors
- 6.7.1 CTRL_State_Idle and EST_State_Idle
- 6.7.2 CTRL_State_OffLine and EST_State_Idle
- 6.7.3 CTRL_State_OnLine and EST_State_RoverL
- 6.7.4 CTRL_State_OnLine and EST_State_Rs
- 6.7.5 CTRL_State_OnLine and EST_State_RampUp
- 6.7.6 CTRL_State_OnLine and EST_State_IdRated
- 6.7.7 CTRL_State_OnLine and EST_State_RatedFlux
- 6.7.8 CTRL_State_OnLine and EST_State_RampDown
- 6.7.9 CTRL_State_Idle and EST_State_LockRotor
- 6.7.10 CTRL_State_OnLine and EST_State_Ls
- 6.7.11 CTRL_State_OnLine and EST_State_Rr
- 6.7.12 CTRL_State_OnLine and EST_State_RampDown
- 6.7.13 CTRL_State_OnLine and EST_State_MotorIdentified
- 6.7.14 CTRL_State_Idle and EST_State_Idle
- 6.8
Recalibration of PMSM and ACIM Motor Identification
- 6.8.1 Recalibration of PMSM and ACIM Motors After Full Identification
- 6.8.2 Recalibration of PMSM and ACIM Motors after Using Parameters from user.h
- 6.9 Setting PMSM Motor Parameters in user.h
- 6.10
Troubleshooting Motor Identification
- 6.10.1
Troubleshooting PMSM Motor Identification
- 6.10.1.1 Identifying PMSM Motors When Load Cannot be Detached
- 6.10.1.2 Can Motor Rotate with the Attached Load?
- 6.10.1.3 Run First Three Steps of Identification
- 6.10.1.4 Run Using Motor Parameters from user.h
- 6.10.1.5 Troubleshooting Motor Shaft Stopping During Ramp-Up
- 6.10.1.6 Troubleshooting Motor Shaft for Smoother Ramp
- 6.10.1.7 Troubleshooting Flux Measurement
- 6.10.1.8 Troubleshooting Ls Identification
- 6.10.1.9 Identifying High-Cogging Torque PMSM Motors
- 6.10.2 Troubleshooting ACIM Motor Identification
- 6.10.1
Troubleshooting PMSM Motor Identification
- 7 Inertia Identification
-
8 MCU Considerations
- 8.1 Overview
- 8.2 InstaSPIN-Enabled Devices
- 8.3 ROM and User Memory Overview
- 8.4 Details on CPU Load and Memory Footprint Measurements
- 8.5 Memory Footprint
- 8.6 CPU Load
- 8.7 Digital and Analog Pins
- 9 Real-Time Structure
- 10Managing Startup Time
-
11Tuning Regulators
- 11.1 PI Controllers Introduction
- 11.2 PI Design for Current Controllers
- 11.3 PI Design for Speed Controllers
- 11.4 Calculating PI Gains Based On Stability and Bandwidth
- 11.5 Calculating Speed and Current PI Gains Based on Damping Factor
- 11.6 Considerations When Adding Poles to the Speed Loop
- 11.7 Speed PI Controller Considerations: Current Limits, Clamping and Inertia
- 11.8 Considerations When Designing PI Controllers for FOC Systems
- 11.9 Sampling and Digital Systems Considerations
-
12InstaSPIN-MOTION™ Controllers
- 12.1 Overview
- 12.2 Stability
- 12.3 Software Configuration for the SpinTAC™ Velocity Control
- 12.4 Optimal Performance in Speed Control
- 12.5 Software Configuration for SpinTAC™ Position Control
- 12.6 Optimal Performance in Position Control
-
13Trajectory Planning
- 13.1 InstaSPIN-MOTION™ Profile Generation
- 13.2 Software Configuration for SpinTAC™ Velocity Move
- 13.3 Software Configuration for SpinTAC™ Position Move
- 13.4
InstaSPIN-MOTION™ Sequence Planning
- 13.4.1 SpinTAC™ Velocity Plan Elements
- 13.4.2 SpinTAC™ Velocity Plan Element Limits
- 13.4.3 SpinTAC™ Velocity Plan Example: Washing Machine Agitation
- 13.4.4 SpinTAC™ Velocity Plan Example: Garage Door
- 13.4.5 SpinTAC™ Velocity Plan Example: Washing Machine
- 13.4.6 SpinTAC™ Position Plan Example: Vending Machine
- 13.5
Software Configuration for SpinTAC™ Velocity Plan
- 13.5.1 Include the Header File
- 13.5.2 Define the Size of the Configuration Array
- 13.5.3 Declare the Global Structure
- 13.5.4 Initialize the Configuration Variables
- 13.5.5 Call SpinTAC™ Velocity Plan
- 13.5.6 Call SpinTAC™ Velocity Plan Tick
- 13.5.7 Update SpinTAC™ Velocity Plan with SpinTAC™ Velocity Move Status
- 13.6 Troubleshooting SpinTAC™ Velocity Plan
- 13.7
Software Configuration for SpinTAC™ Position Plan
- 13.7.1 Include the Header File
- 13.7.2 Define the Size of the Configuration Array
- 13.7.3 Declare the Global Structure
- 13.7.4 Initialize the Configuration Variables
- 13.7.5 Call SpinTAC™ Position Plan
- 13.7.6 Call SpinTAC™ Position Plan Tick
- 13.7.7 Update SpinTAC™ Position Plan with SpinTAC™ Position Move Status
- 13.8 Troubleshooting SpinTAC™ Position Plan
- 13.9 Conclusion
-
14Managing Full Load at Startup, Low-Speed, and Speed
Reversal
- 14.1 Overview
- 14.2 Low-Speed Operation with Full Load
- 14.3 Speed Reversal with Full Load
- 14.4 Motor Startup with Full Load
- 14.5 Rapid Acceleration from Standstill With Full Load
- 14.6 Overloading and Motor Overheating
- 14.7 InstaSPIN-MOTION™ and Low-Speed Considerations
-
15Rs Online Recalibration
- 15.1 Overview
- 15.2 Resistance vs. Temperature
- 15.3 Accurate Rs Knowledge Needed at Low Speeds Including Startup
- 15.4 Introduction to Rs Online Recalibration
- 15.5 Rs Online vs. Rs Offline
- 15.6 Enabling Rs Online Recalibration
- 15.7 Disabling Rs Online Recalibration
- 15.8 Modifying Rs Online Parameters
- 15.9 Monitoring Rs Online Resistance Value
- 15.10 Using the Rs Online Feature as a Temperature Sensor
- 15.11 Rs Online Related State Diagrams (CTRL and EST)
- 16PowerWarp™
- 17Shunt Current Measurements
- 18Sensored Systems
14.6.2 Overloading and Motor Overheating Example
In this example the load is increased 30% above the rated torque of the motor (Figure 15-64). The dynamometer is set to a torque command of 2.5 N·m. Keep in mind that the rated torque capability of this motor is about 1.9 N·m, so in fact we are putting about 130% load to the motor shaft. This will cause the motor to overheat, hence the need for the Rs Online feature to keep an accurate resistance while the motor is running.
In Figure 15-64, where a slow rotating angle, which is due to the Rs Online feature can be seen superimposed on the 5 A amplitude current. To learn more about the Rs Online feature, see Section 16.
 Figure 14-64 Overloading and Motor Overheating Plot
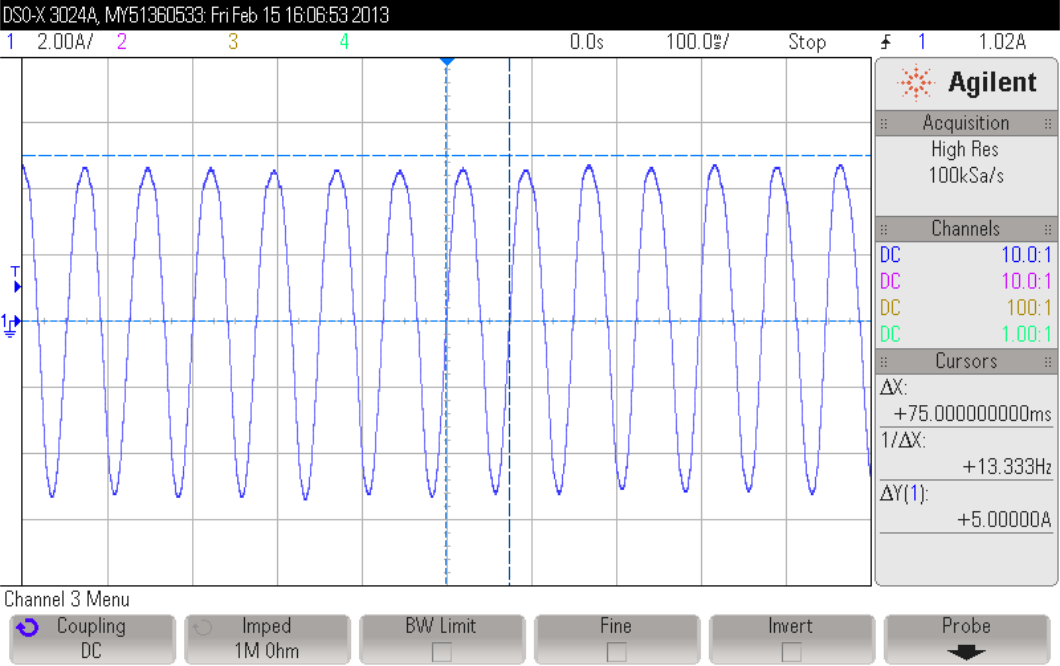
Zooming into the current (Figure 15-65), we can clearly see the frequency to be 13.33 Hz, which is exactly what we command for the speed reference, which in this case is 200 RPM. The conversion is well known, which depends on the number of pole pairs. Speed (RPM) = Speed (Hz) * 60 / Pole Pairs = 13.33 Hz * 60 / 4 = 200 RPM.
 Figure 14-65 Zoom-in on Overloading and Motor Overheating Plot
The stator resistance is captured for a period of 5 minutes (300 seconds) and it is shown in Figure 15-66. It can be seen that the value we start with is 2.8 Ohms, and during a period of about 200 seconds it reaches about 3.45 Ohms, stabilizing at this value.
 Figure 14-66 Stator Resistance Plot
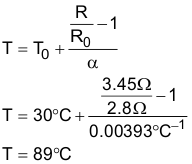
With this increase, we have a difference in resistance of (3.45-2.8)/2.8 * 100% = 23% increase. Applying the equations we use in Section 16, this difference in resistance represents a motor temperature of:

The following estimated values were taken after 10 minutes of working, where the resistance measures about 3.5 Ohms. The estimated flux (Figure 15-67) measures a value very close to the rated flux of 0.5 V/Hz.
 Figure 14-67 Flux Plot
We plot the angle (Figure 15-68) when the motor is 30% overloaded.
 Figure 14-68 Angle Plot
Zooming into the angle (Figure 15-69), expanding one second of information, we see a clean and continuous ramp. Keep in mind that the data here was taken every 200 samples, so there is a discontinuity at the end of every cycle.
 Figure 14-69 Zoom-in on Angle Plot
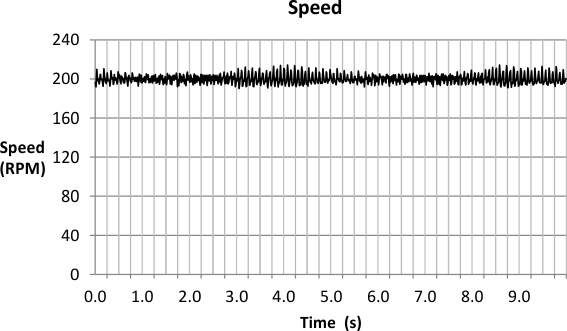
The estimated speed is around 200 RPM, as shown in Figure 15-70.
 Figure 14-70 Speed Plot
The estimated torque is around 2.5 Nm. Estimated torque, when overloading the motor, is also accurate and fairly constant as can be seen in Figure 15-71.
 Figure 14-71 Torque Plot
The current in this example is about 5.2 A or so (Figure 15-72), due to the 30% of overloading for a long period of time, the current must be higher for higher stator resistance value in order to produce the commanded torque.
 Figure 14-72 Iq Current Plot