SWRA824 October 2024 CC1120
5 Conducted Emissions Testing and Results
The test platform included the conducted emissions test board powered by a 24V DC input. This board was then connected to the Smart RF transceiver evaluation board, used in combination with Smart RF Studio, which allows for user access to the devices registers for configuration of the radio parameters and behavior. It also provides a control interface for performing operations such as setting up a continuous wave signal, which was used in this application. Lastly, a spectrum analyzer was connected to the radiated emissions test board to measure the frequency response at the antenna.
Figure 5-1 shows the setup used for testing.
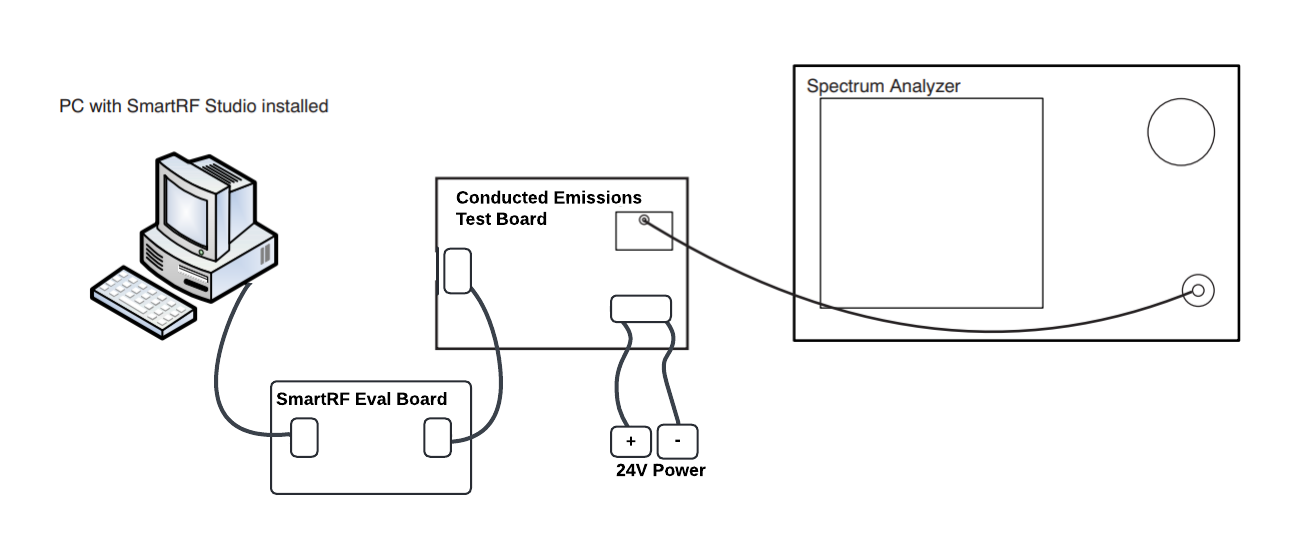 Figure 5-1 Conducted Emissions Testing Setup
Each buck converter was tested at a transmission power of 0dBm and 15dBm. The span was set to 500kHz and the resolution and video bandwidth were set to 4.7kHz. The following spectrums were observed.
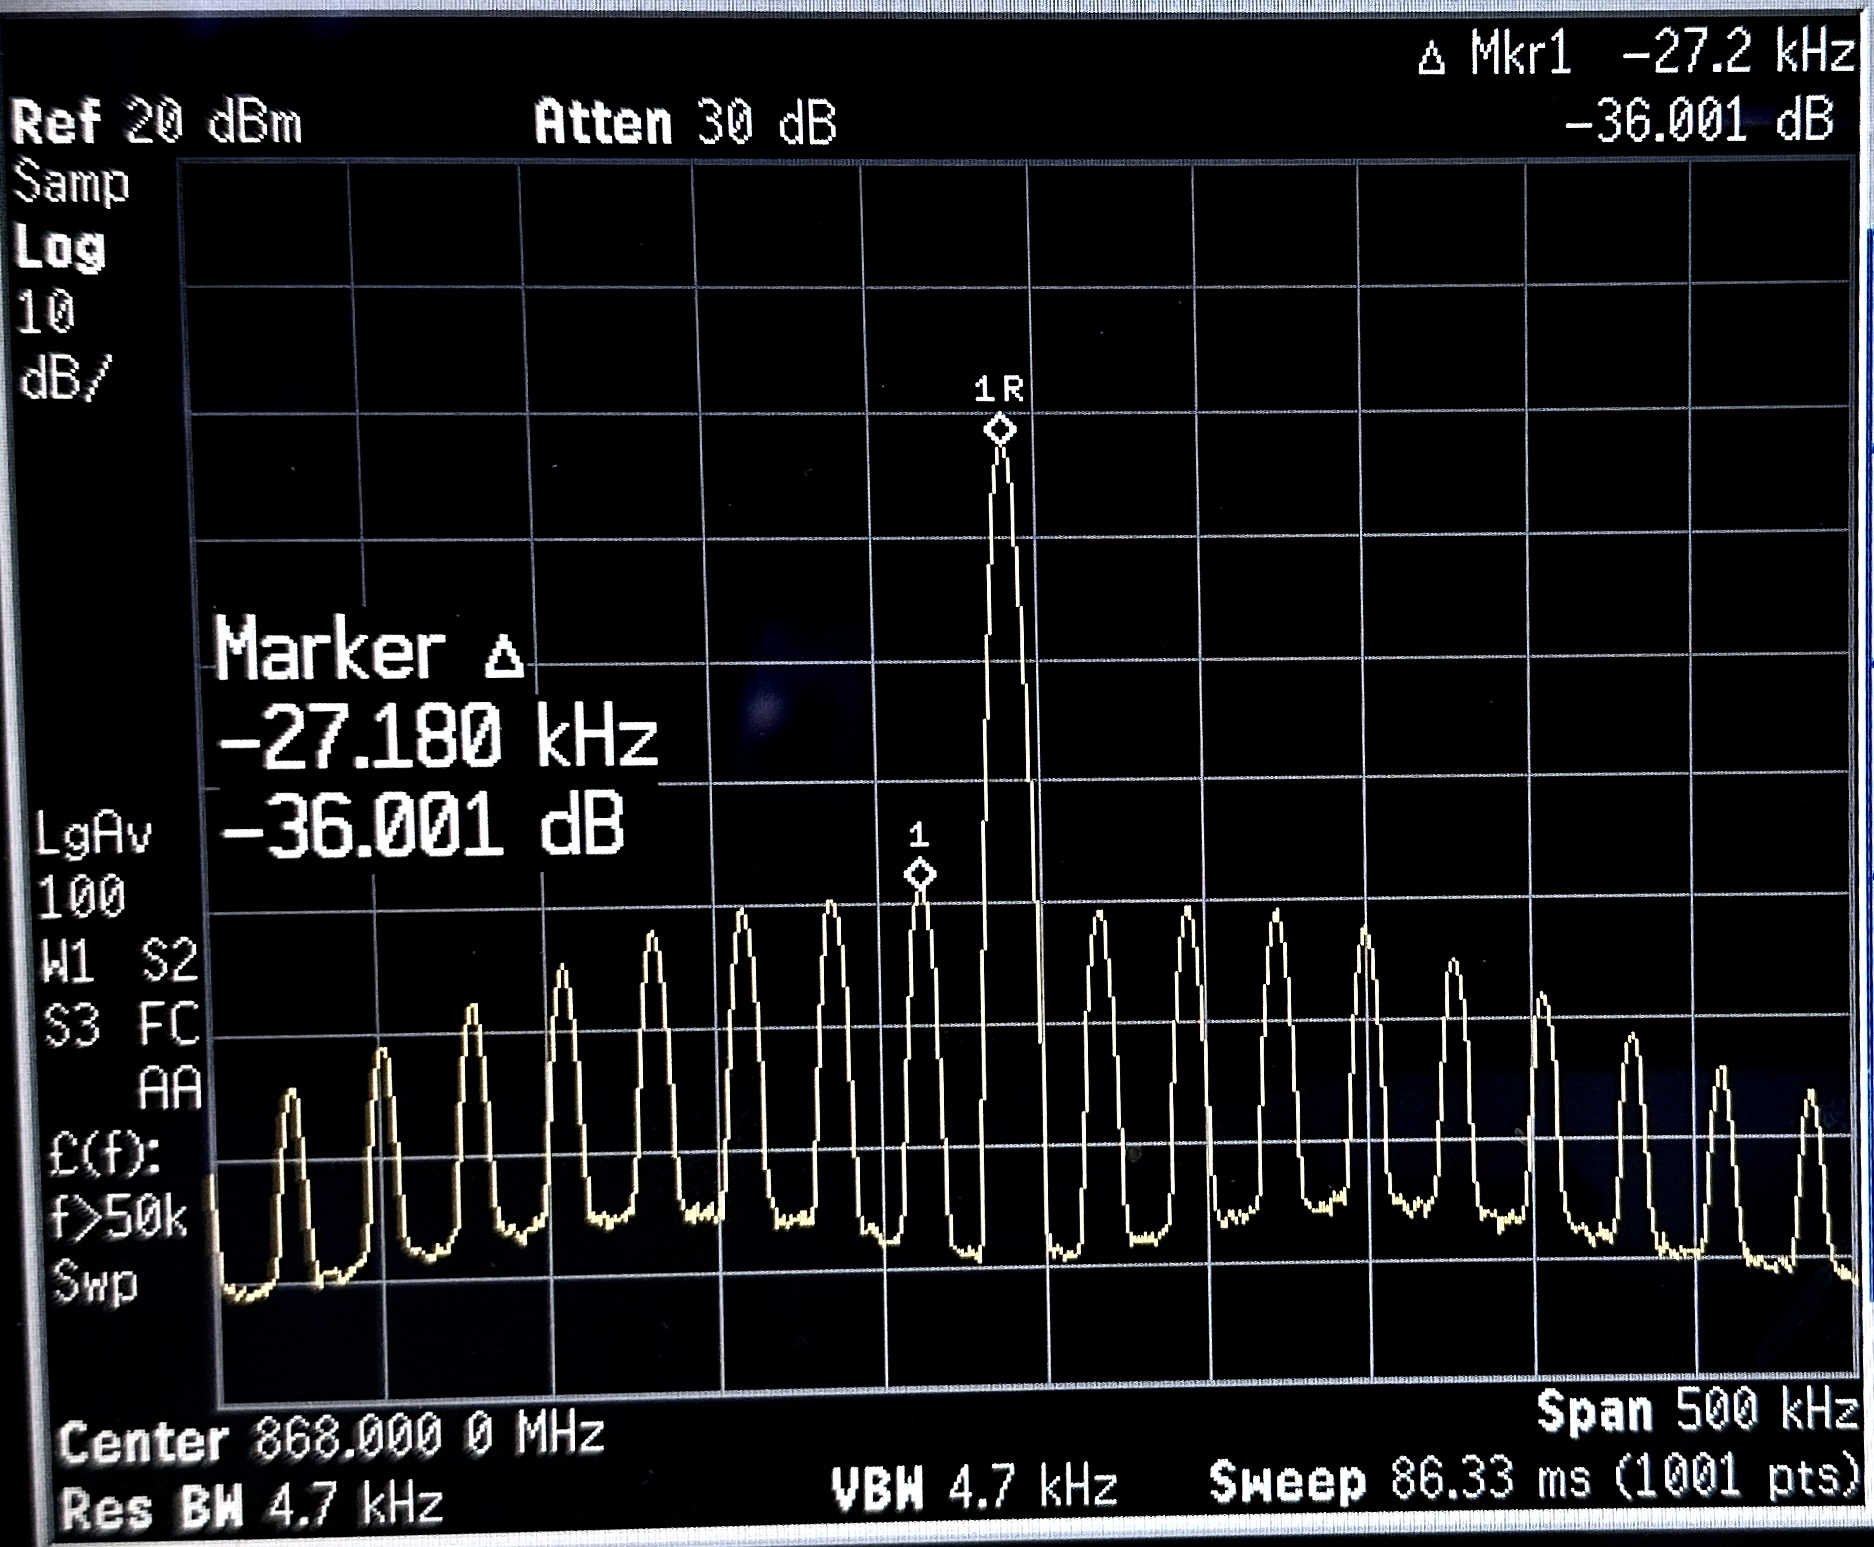 Figure 5-2 LM5166 Frequency Output With 0dBm Transmission Power
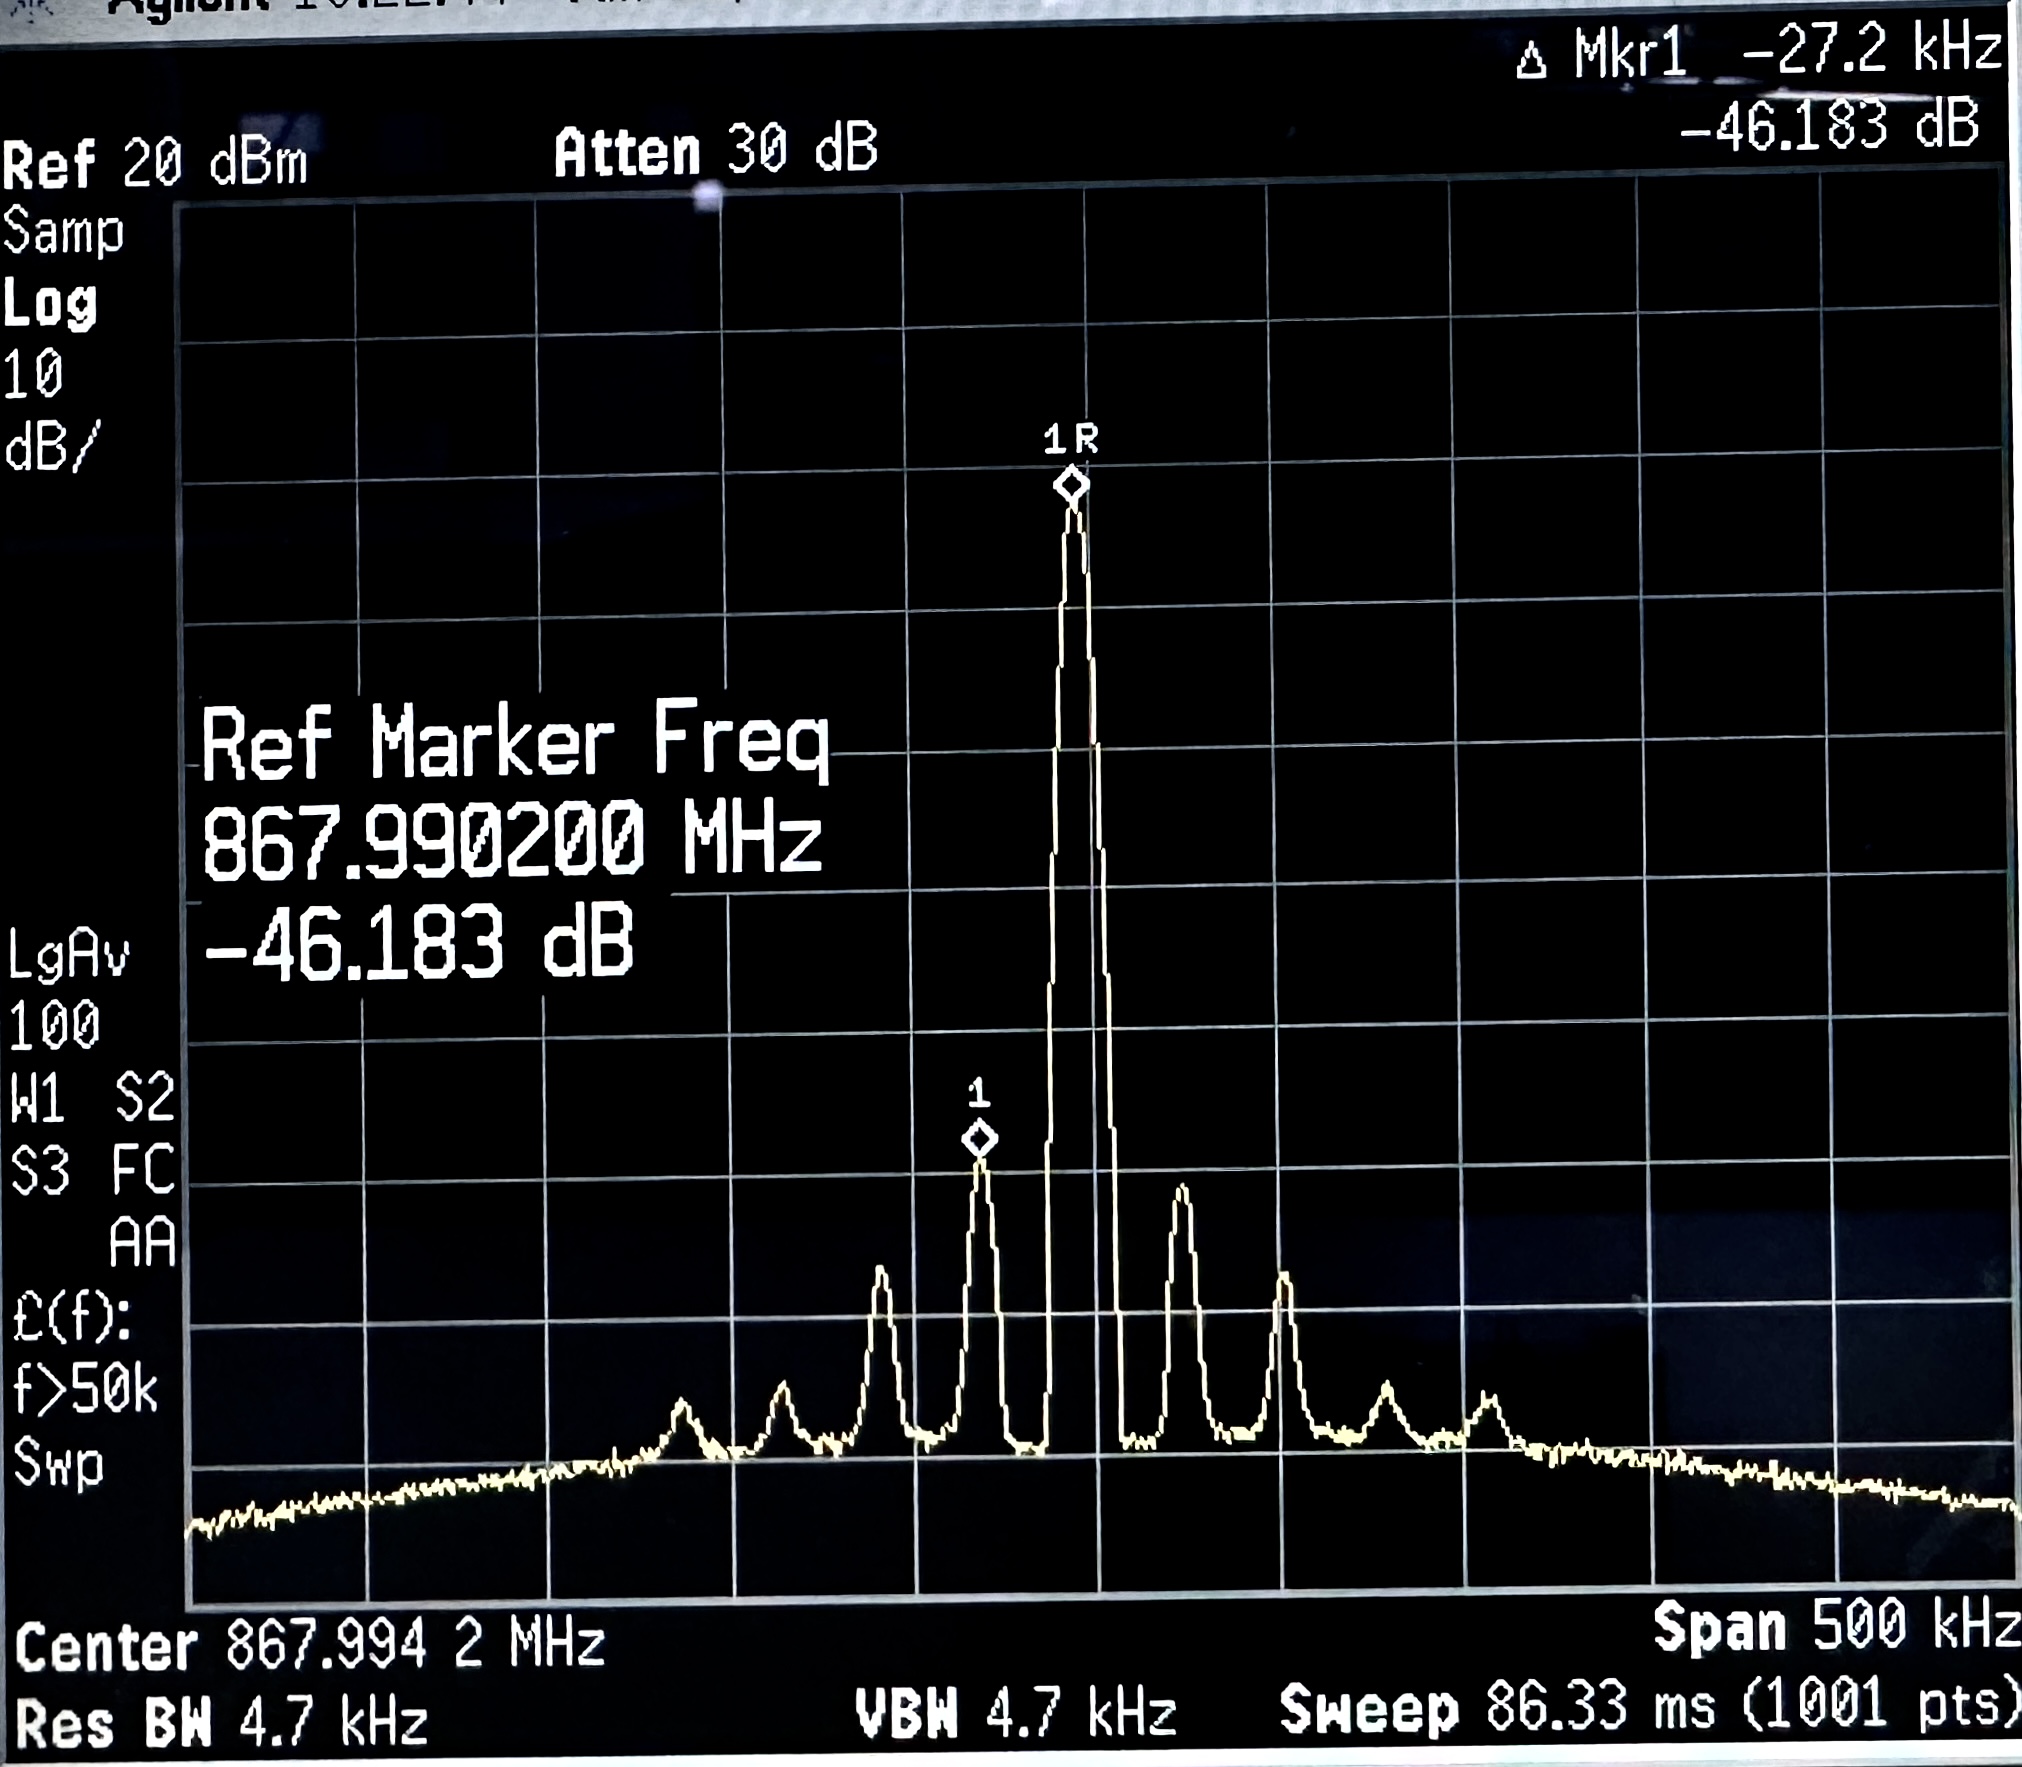 Figure 5-4 LMR38010 Frequency Output With 0dBm Transmission Power
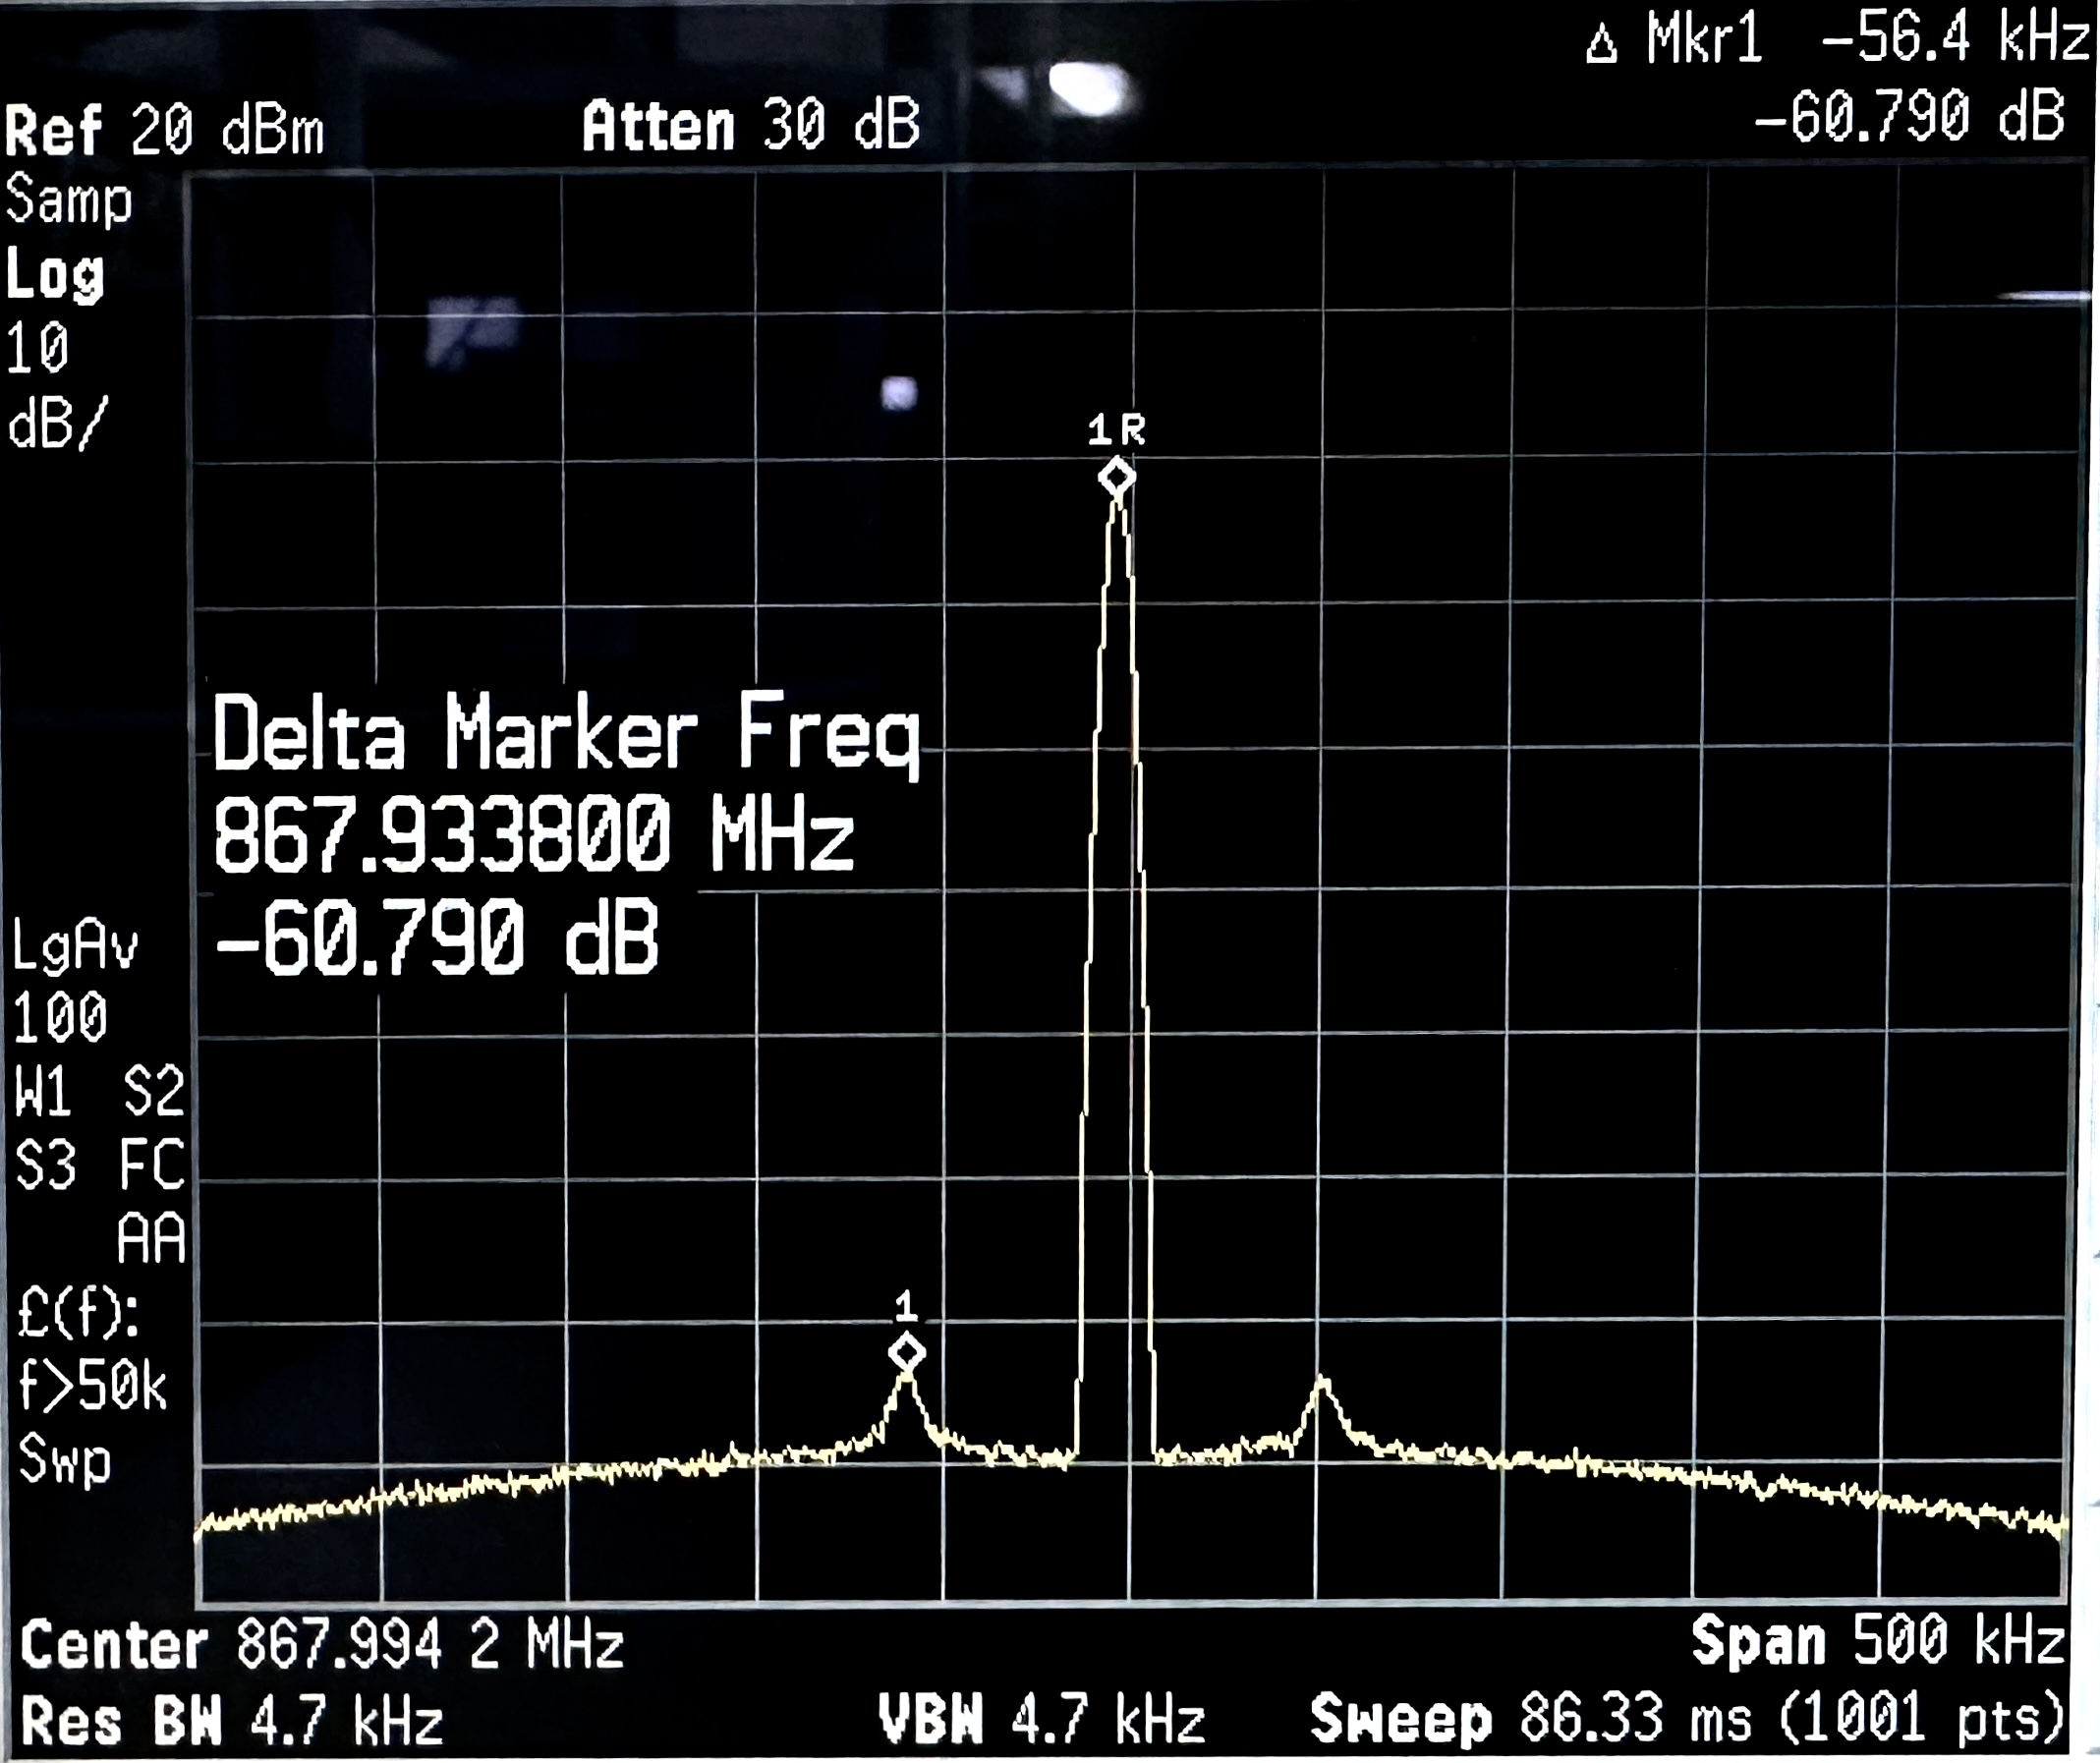 Figure 5-6 LMR36510 Frequency Output With 0dBm Transmission Power
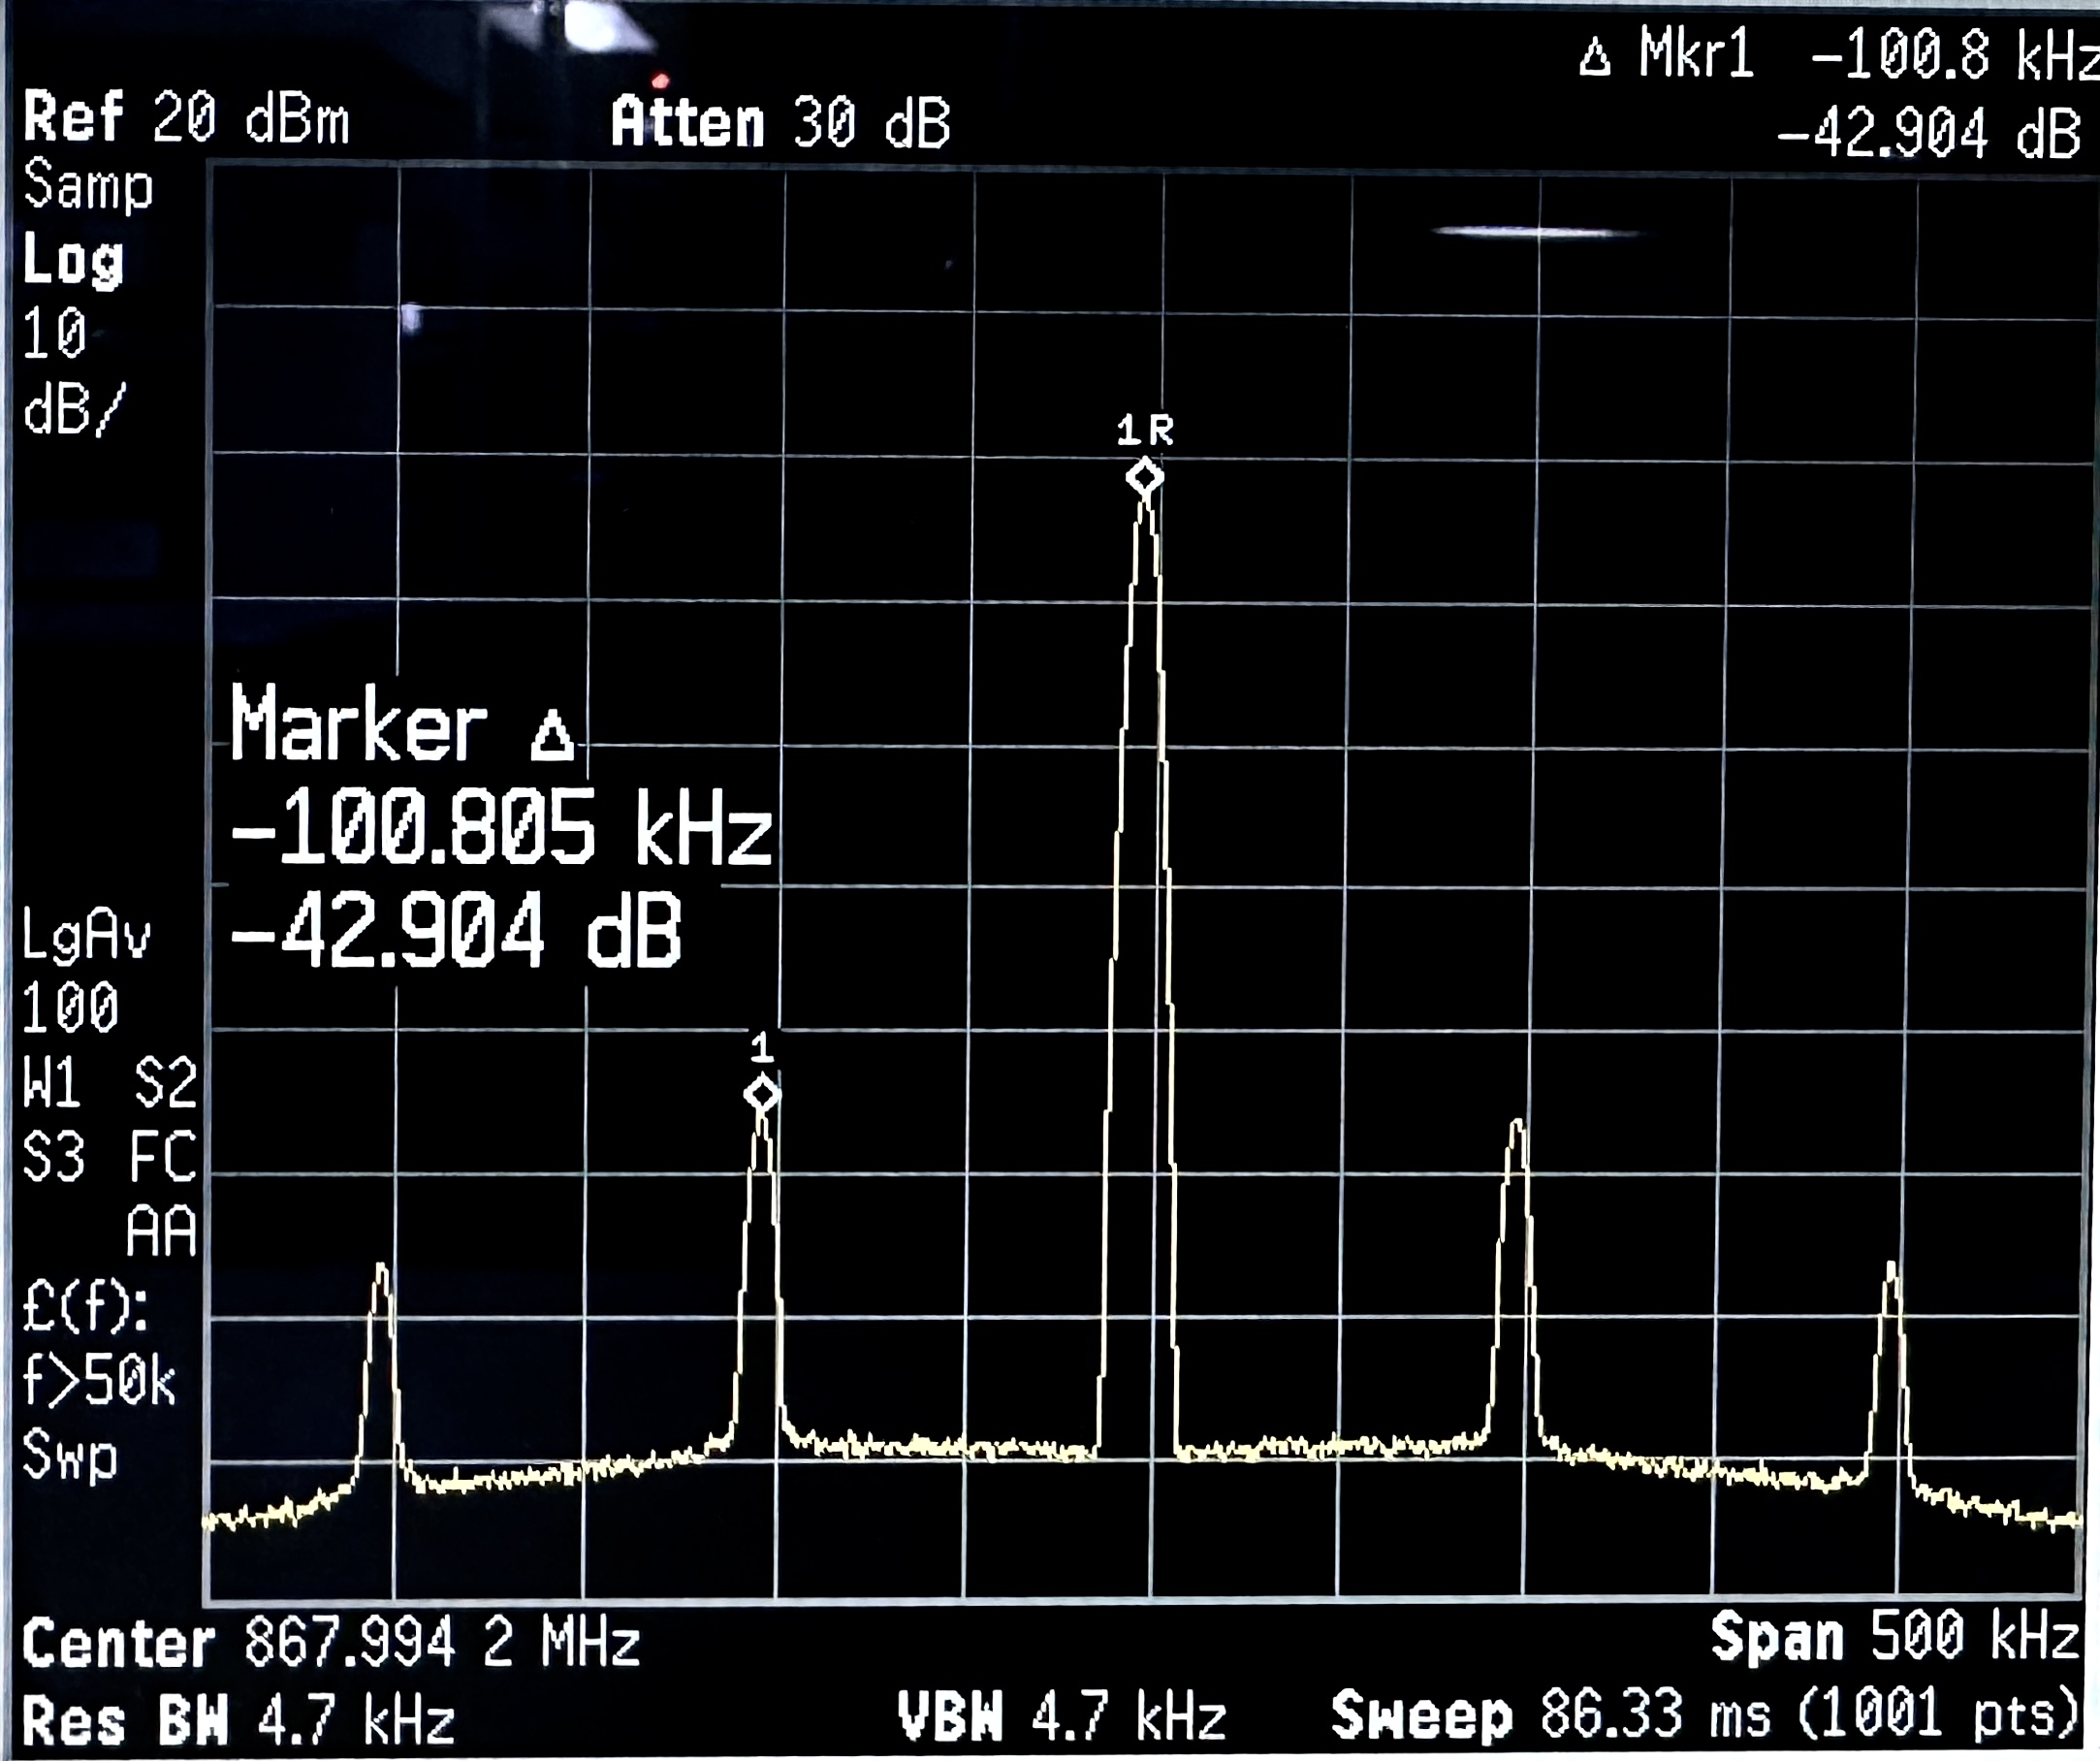 Figure 5-8 LMR36506 Frequency Output With 0dBm Transmission Power at 400kHz Switching Frequency
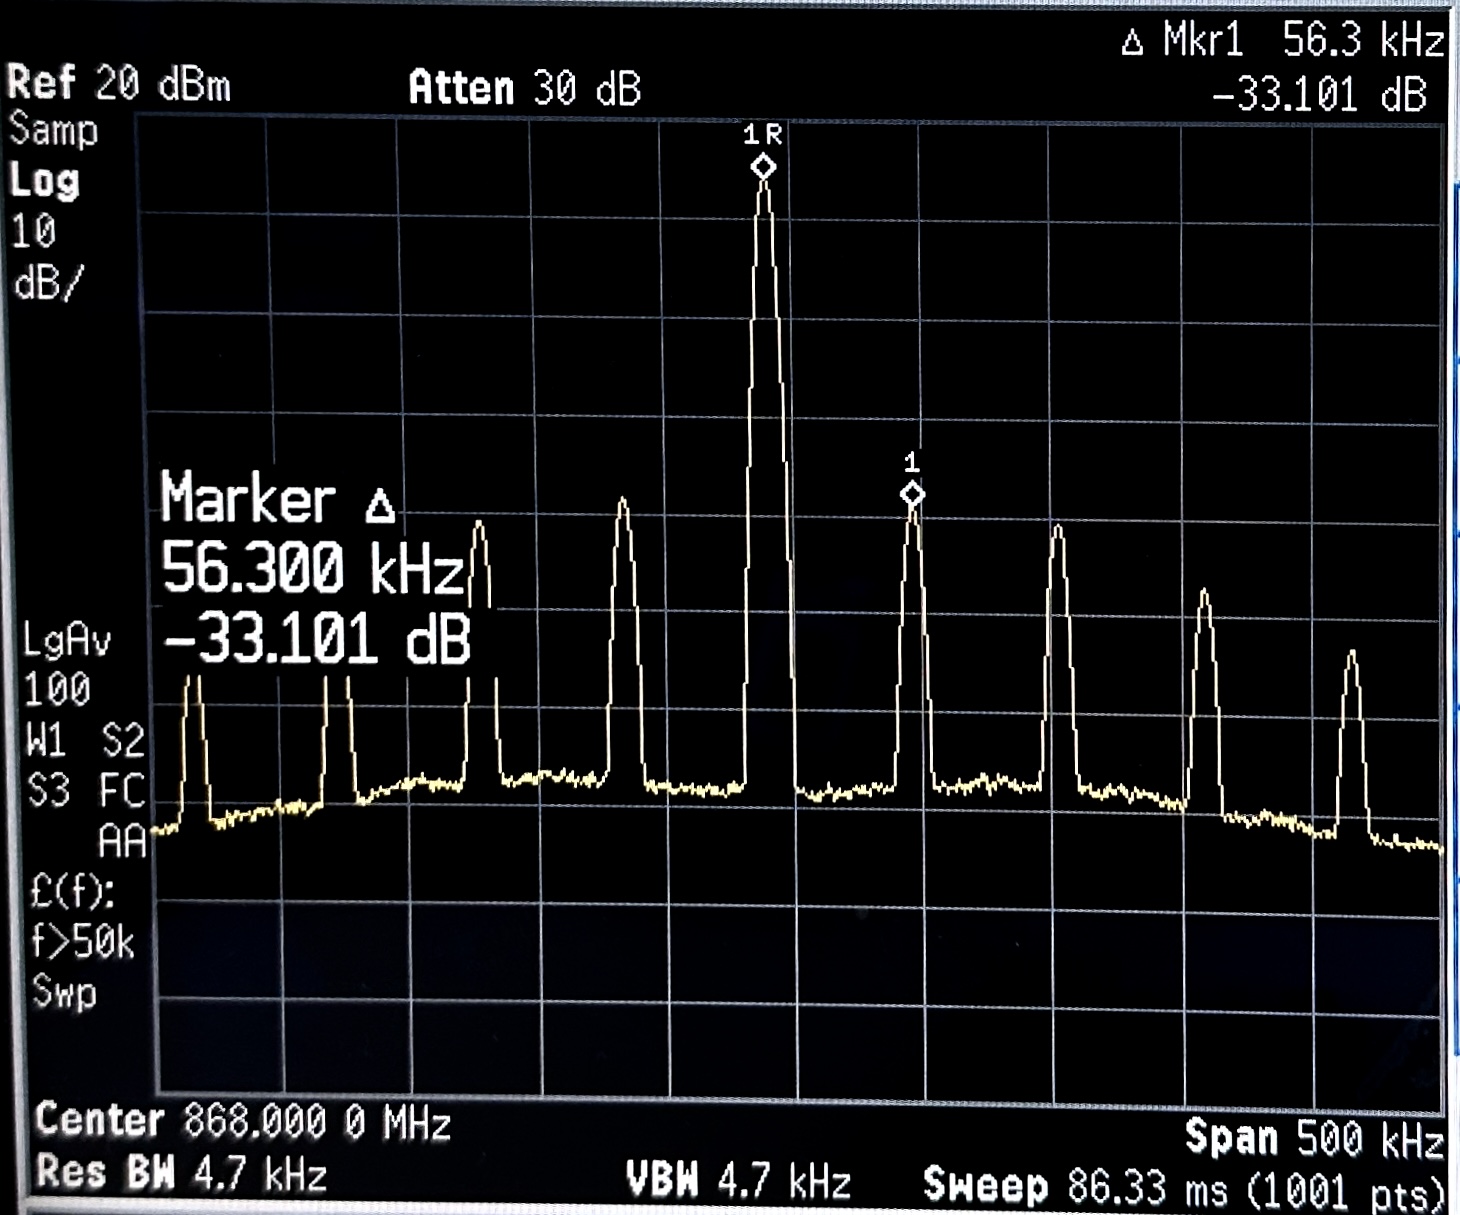 Figure 5-3 LM5166 Frequency Output With 15dBm Transmission Power
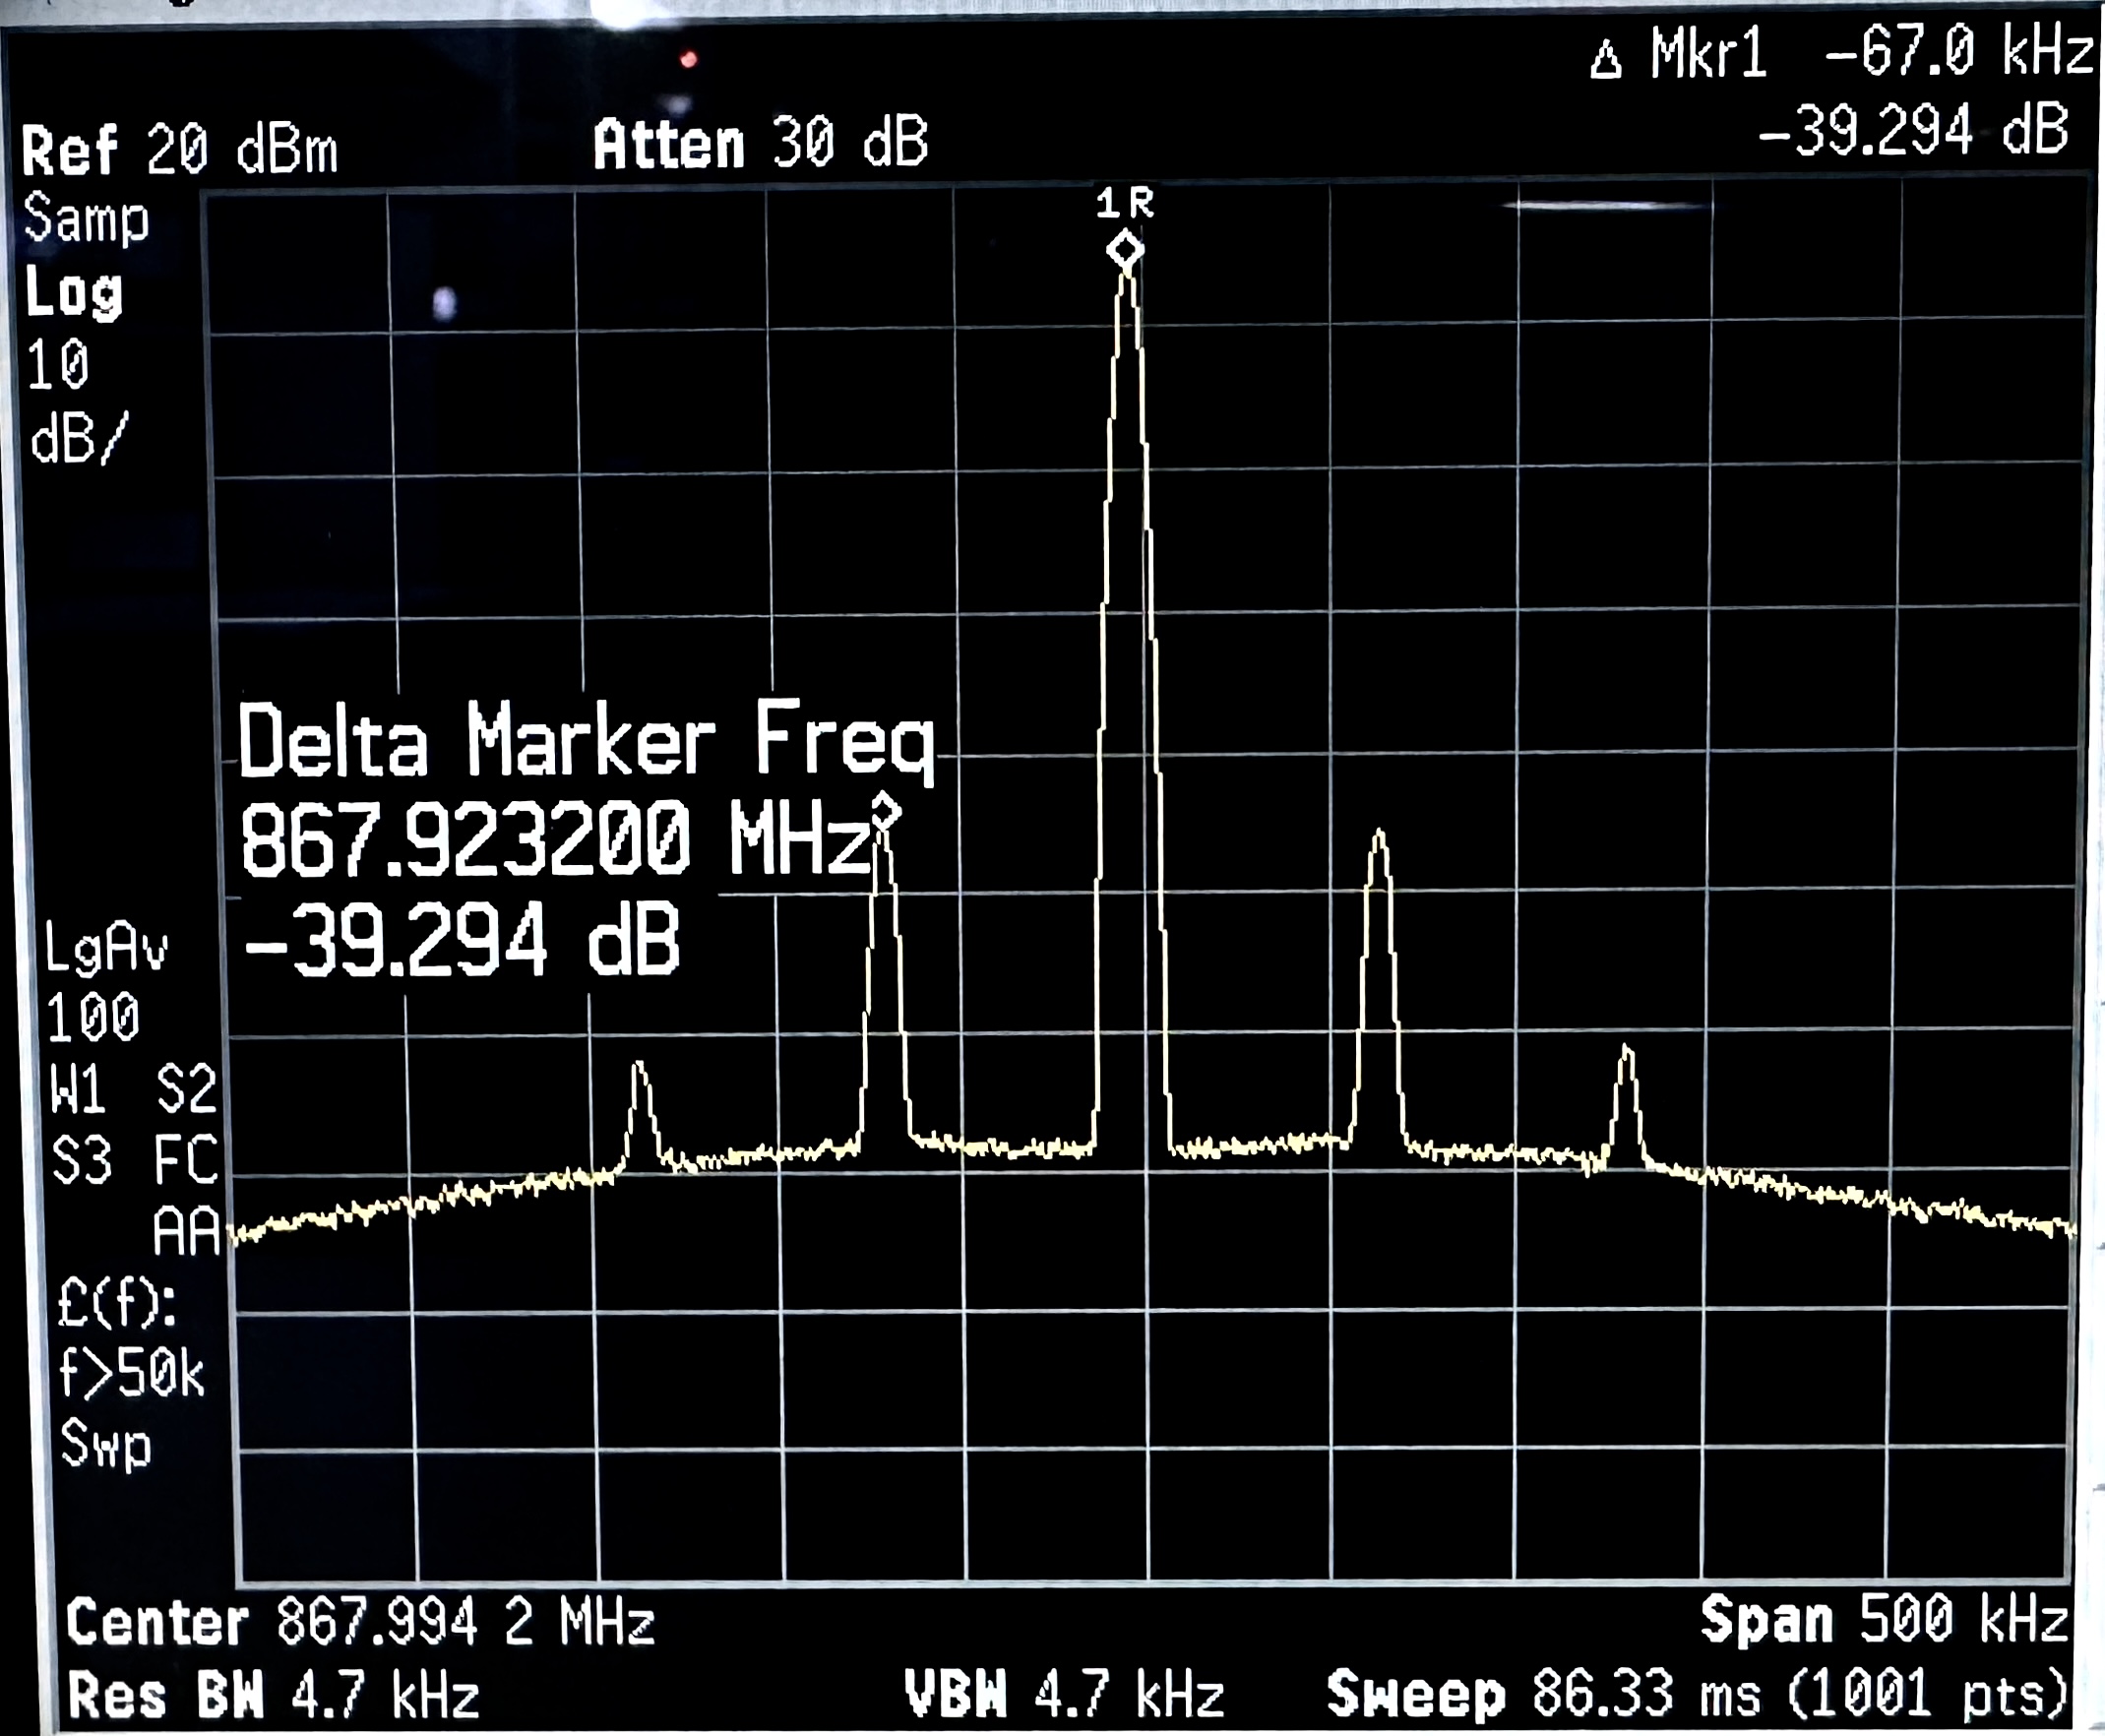 Figure 5-5 LMR38010 Frequency Output With 15dBm Transmission Power
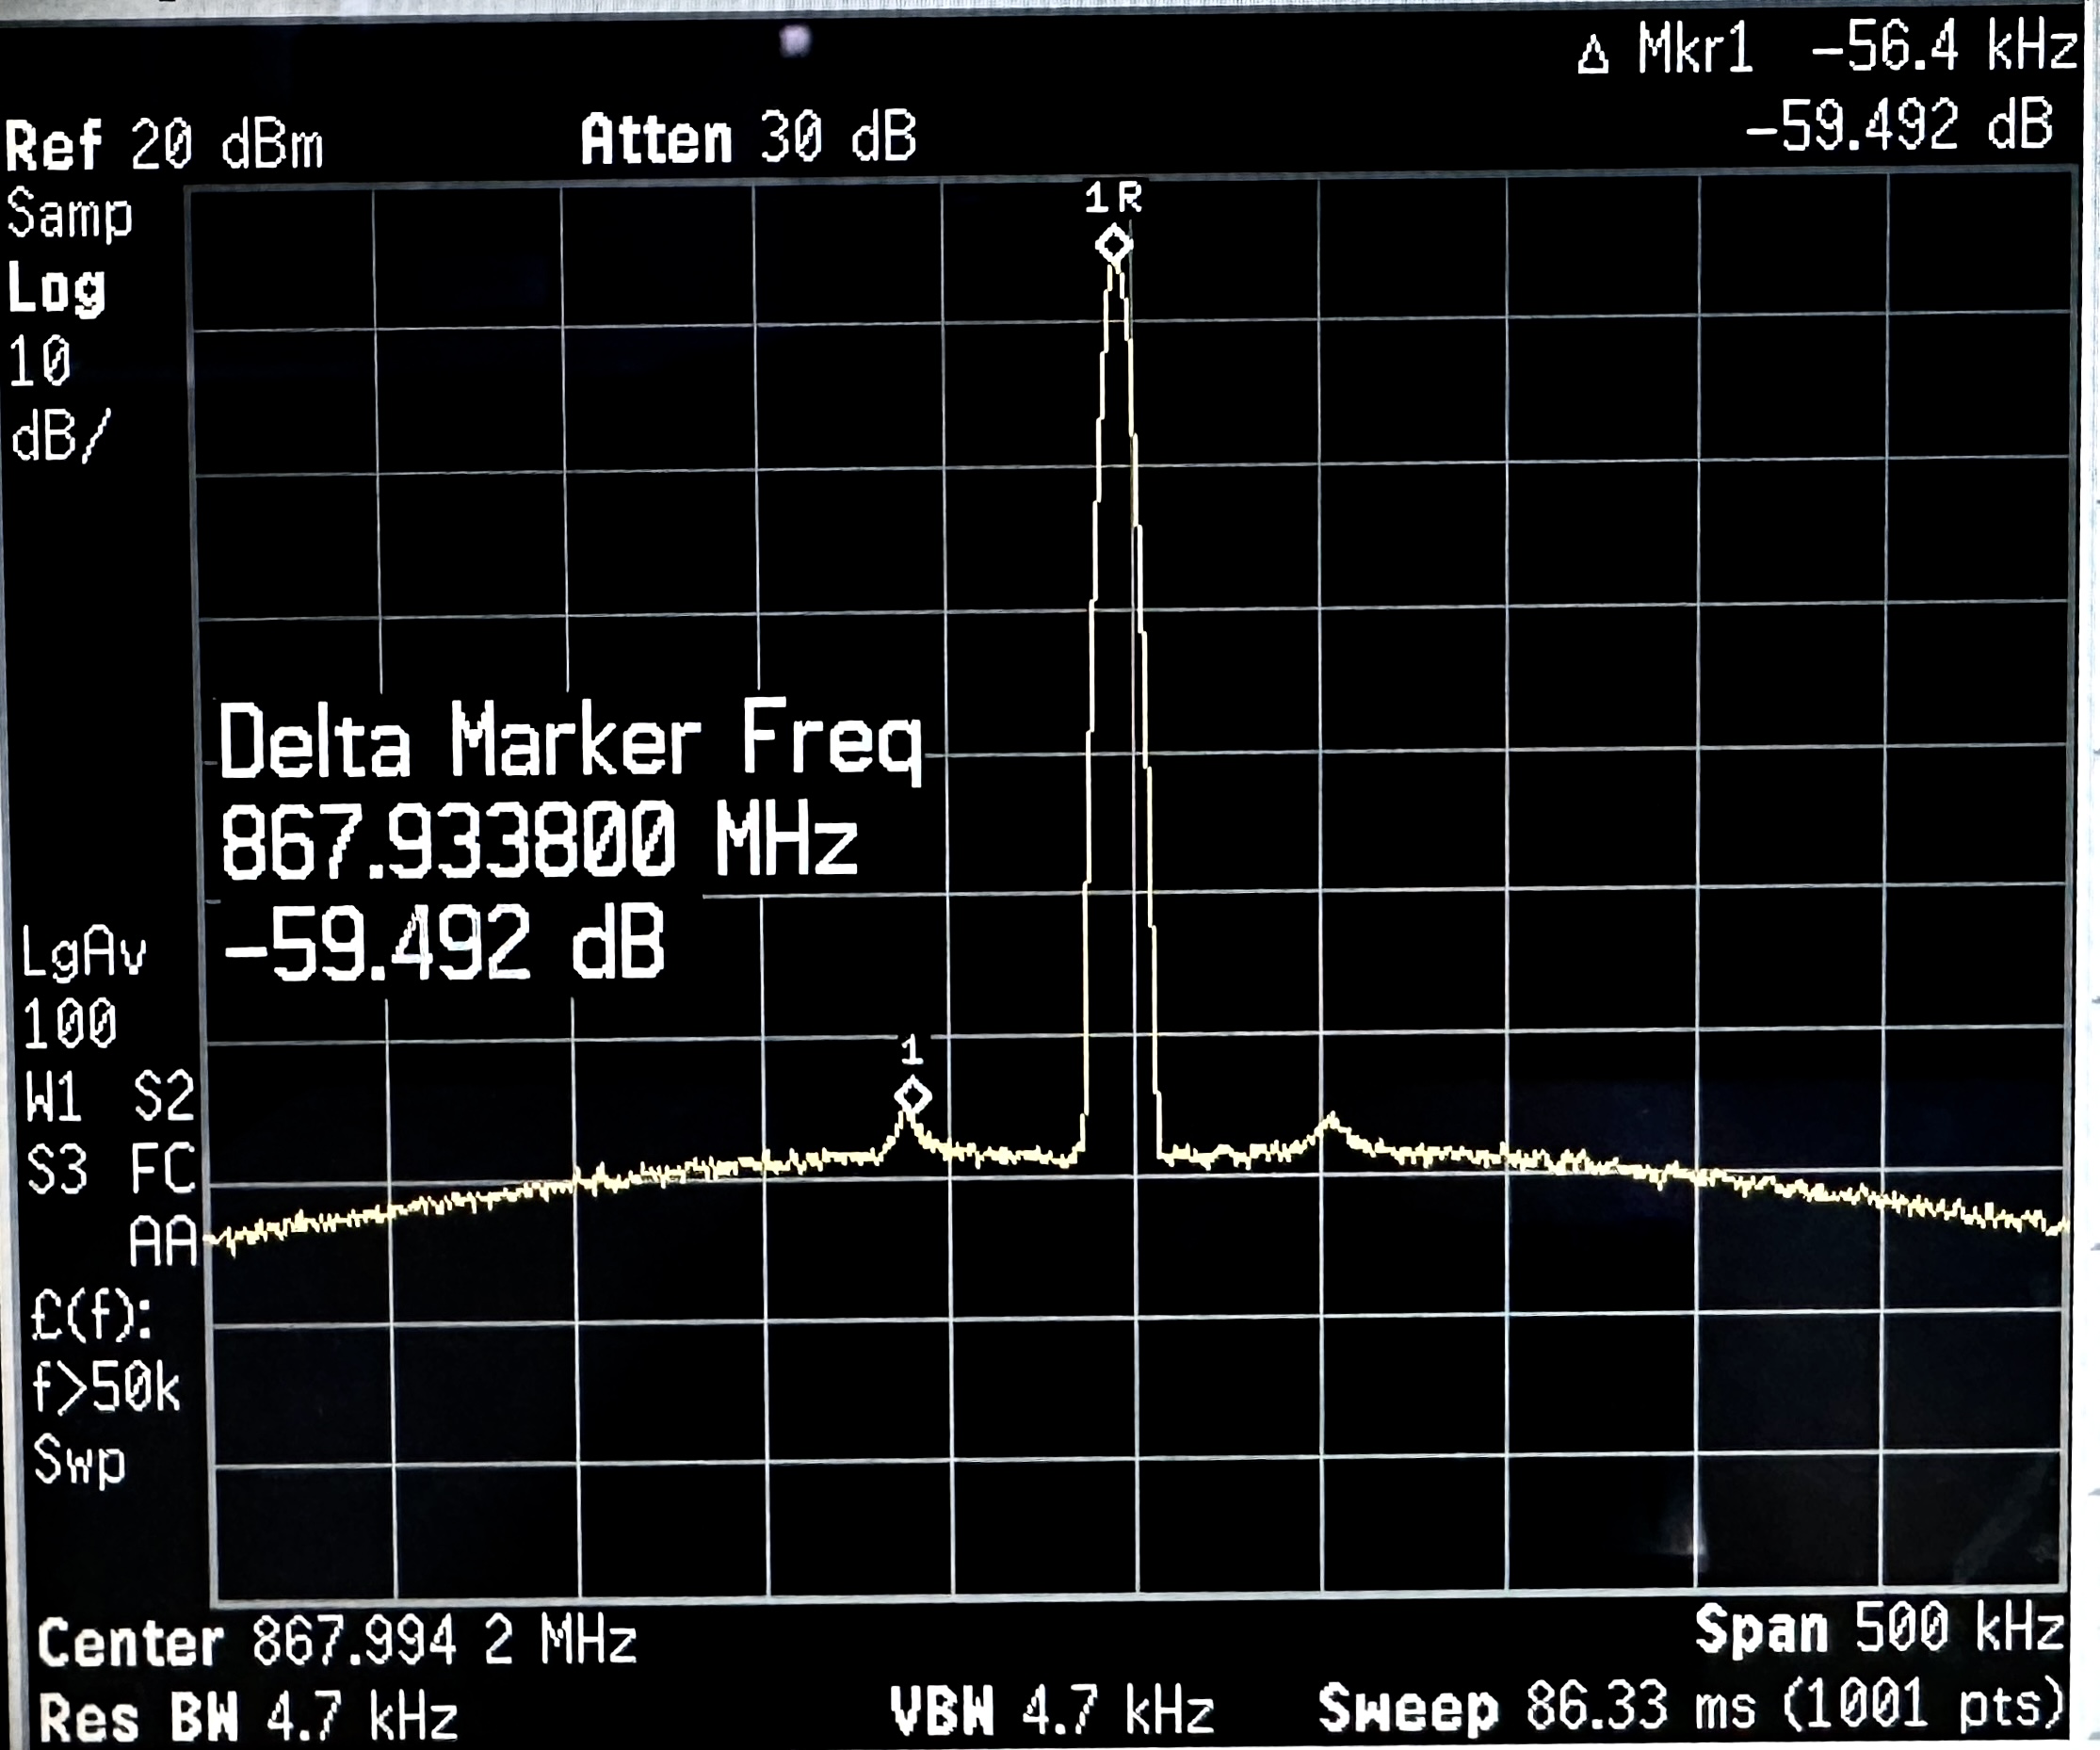 Figure 5-7 LMR36510 Frequency Output With 15dBm Transmission Power
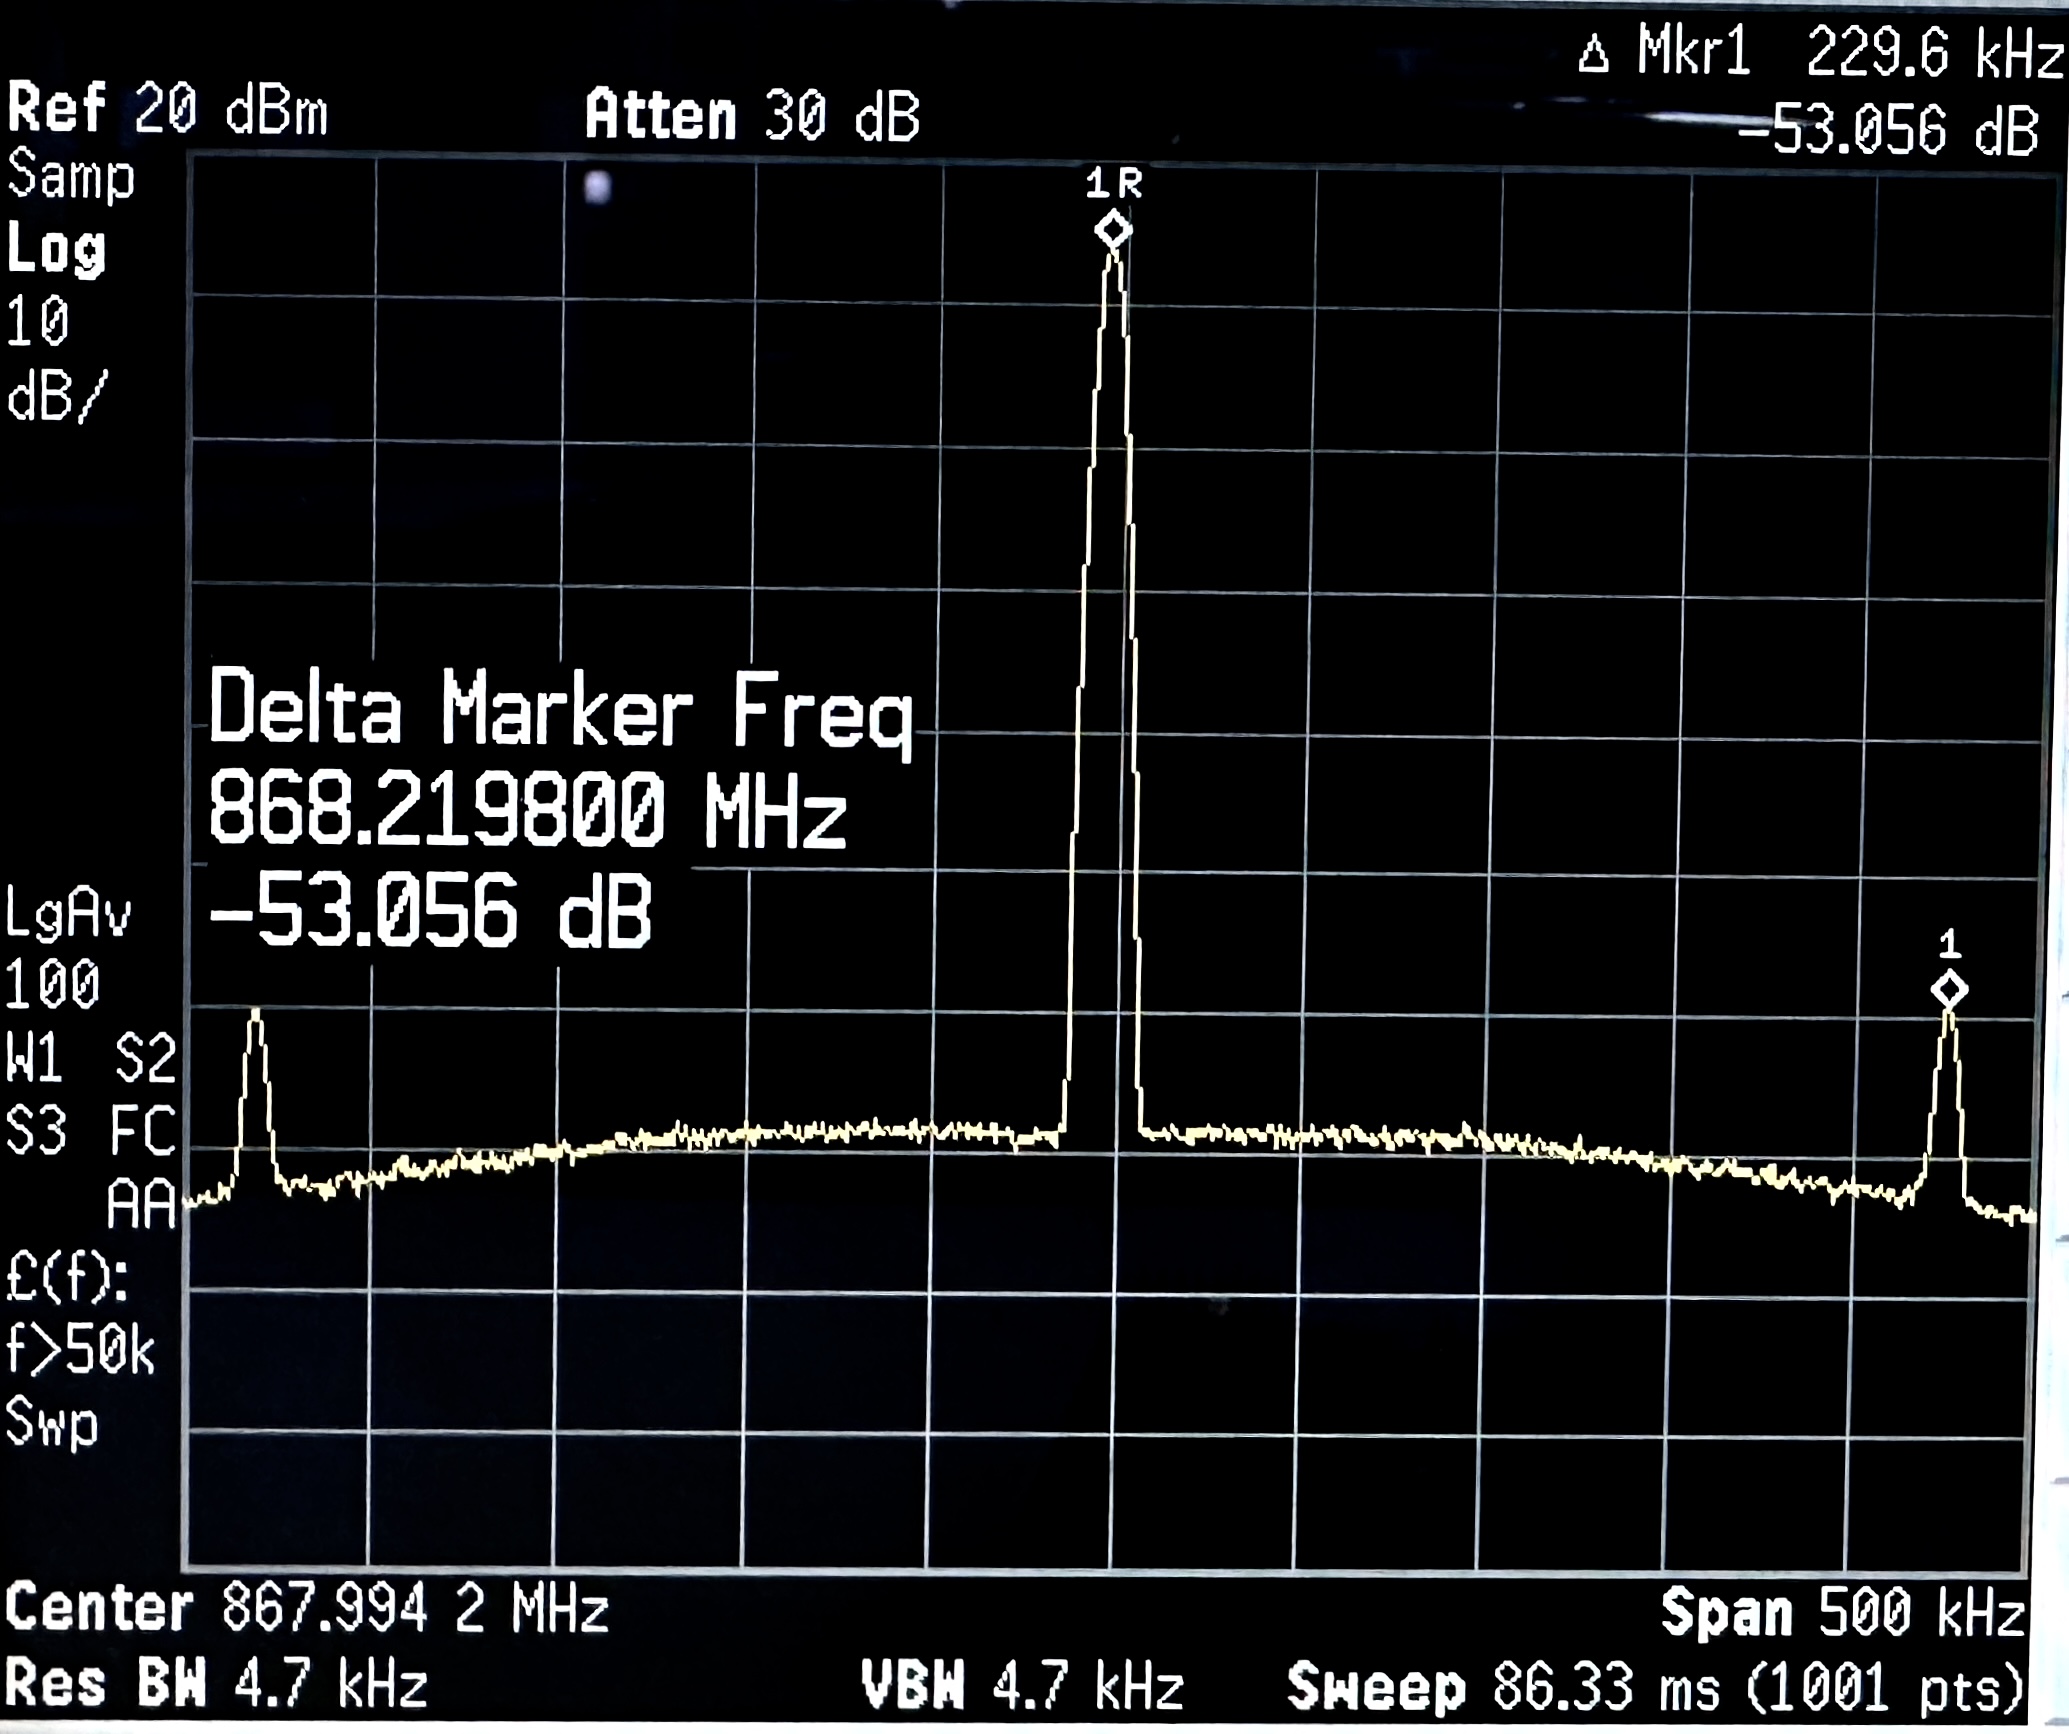 Figure 5-9 LMR36506 Frequency Output With 15dBm Transmission Power at 400kHz Switching Frequency
The LMR36510 and LMR36506 were then tested at an increased span to identify any potential spurs outside of the original 500 kHz span.
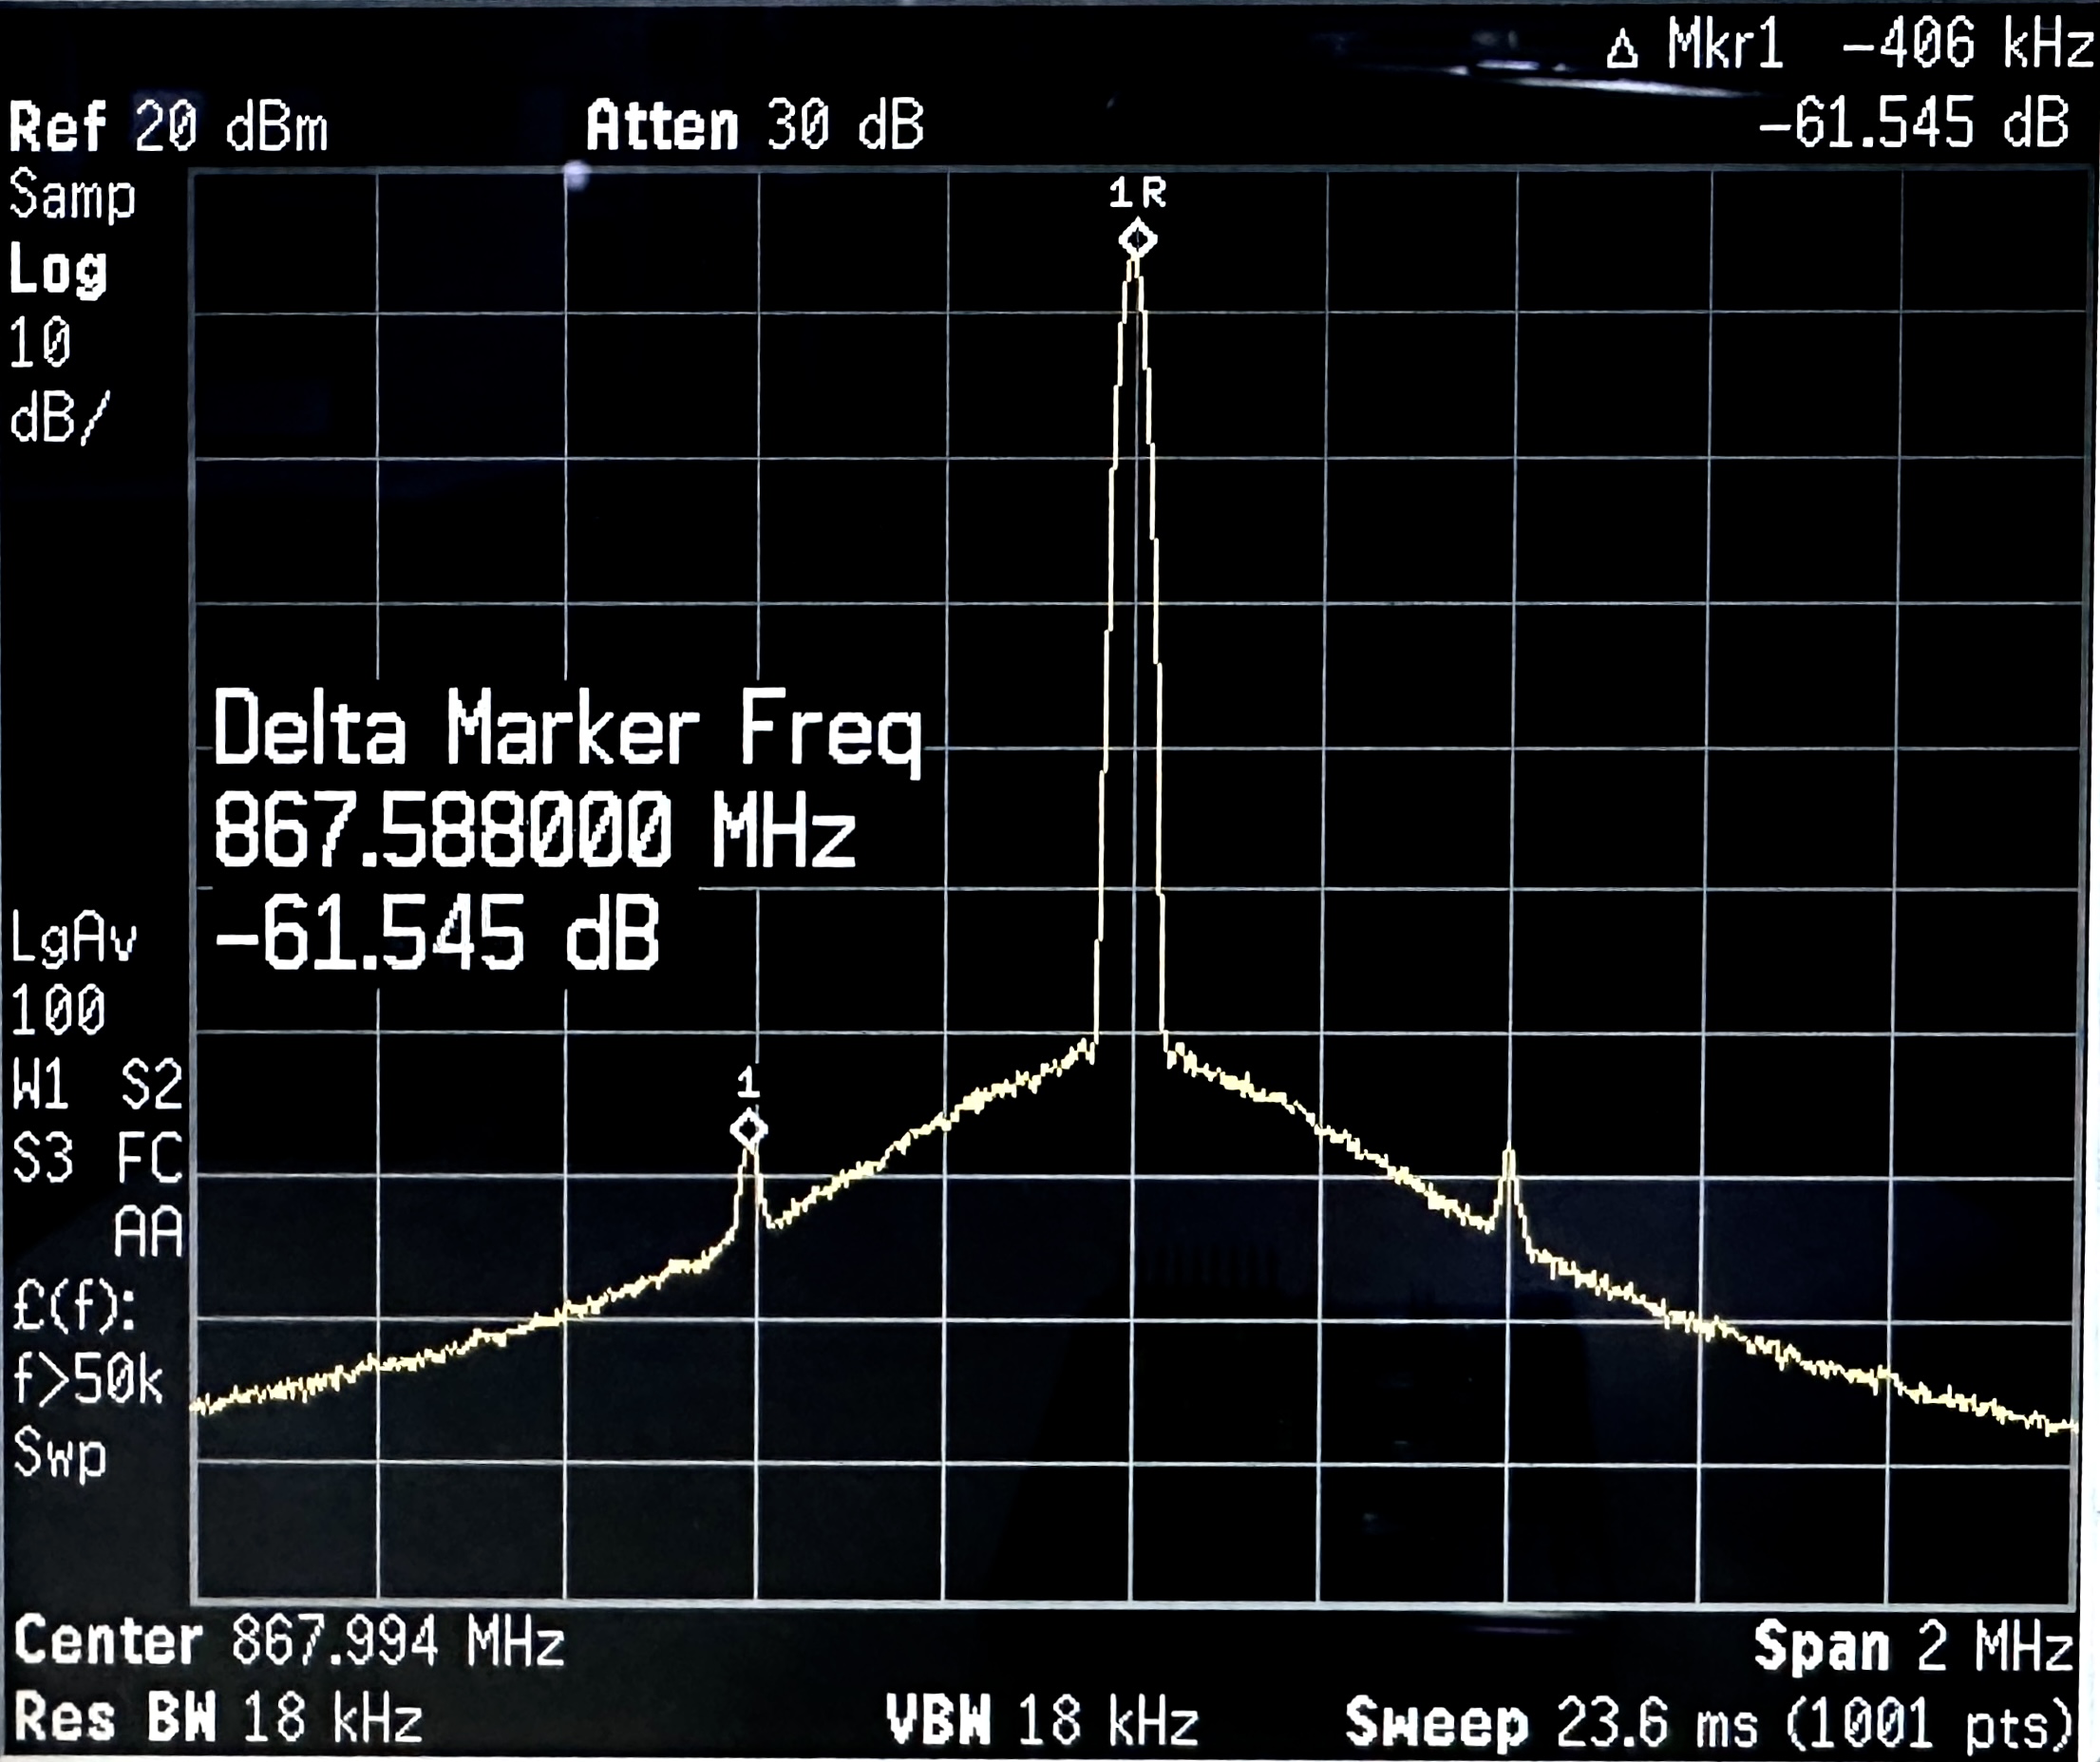 Figure 5-10 LMR36510 Frequency Output With 15dBm Transmission Power at 2MHz Span
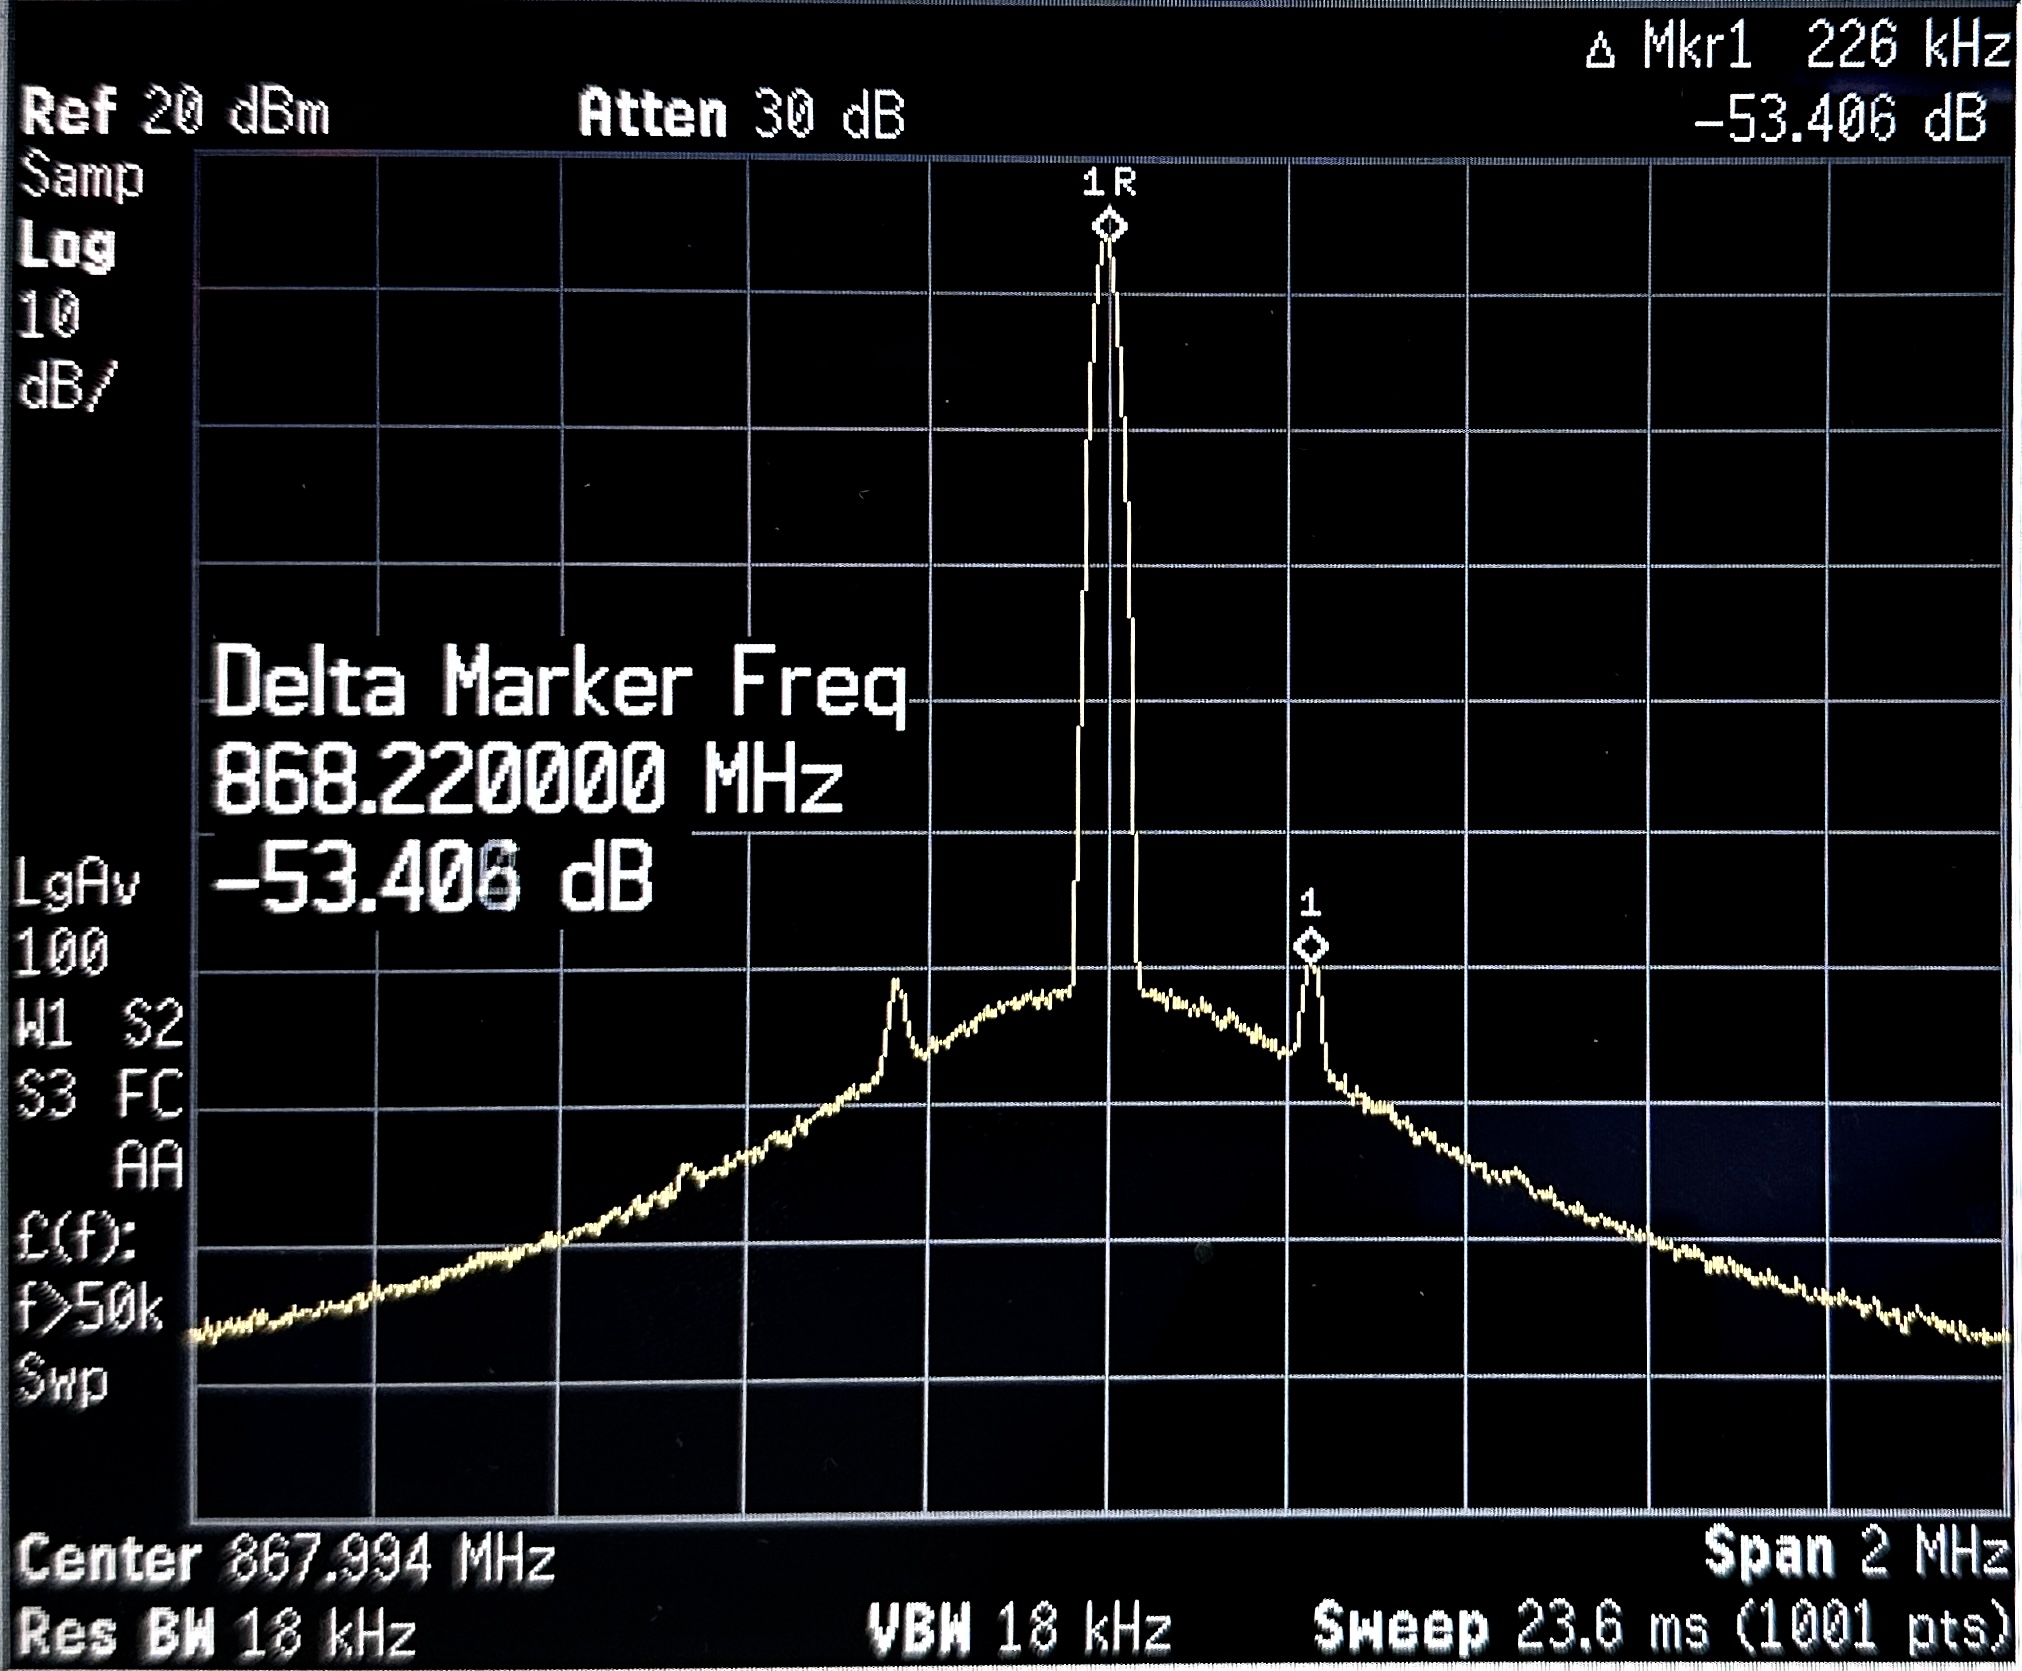 Figure 5-11 LMR36506 Frequency Output With 15dBm Transmission Power at 2MHz Span (400kHz switching frequency)
After observing that the LMR36506 and LMR36510 exhibit improved harmonic distortion compared to the control unit, additional testing was conducted by adjusting the switching frequency of the LMR36506 to determine if further improvements were possible.
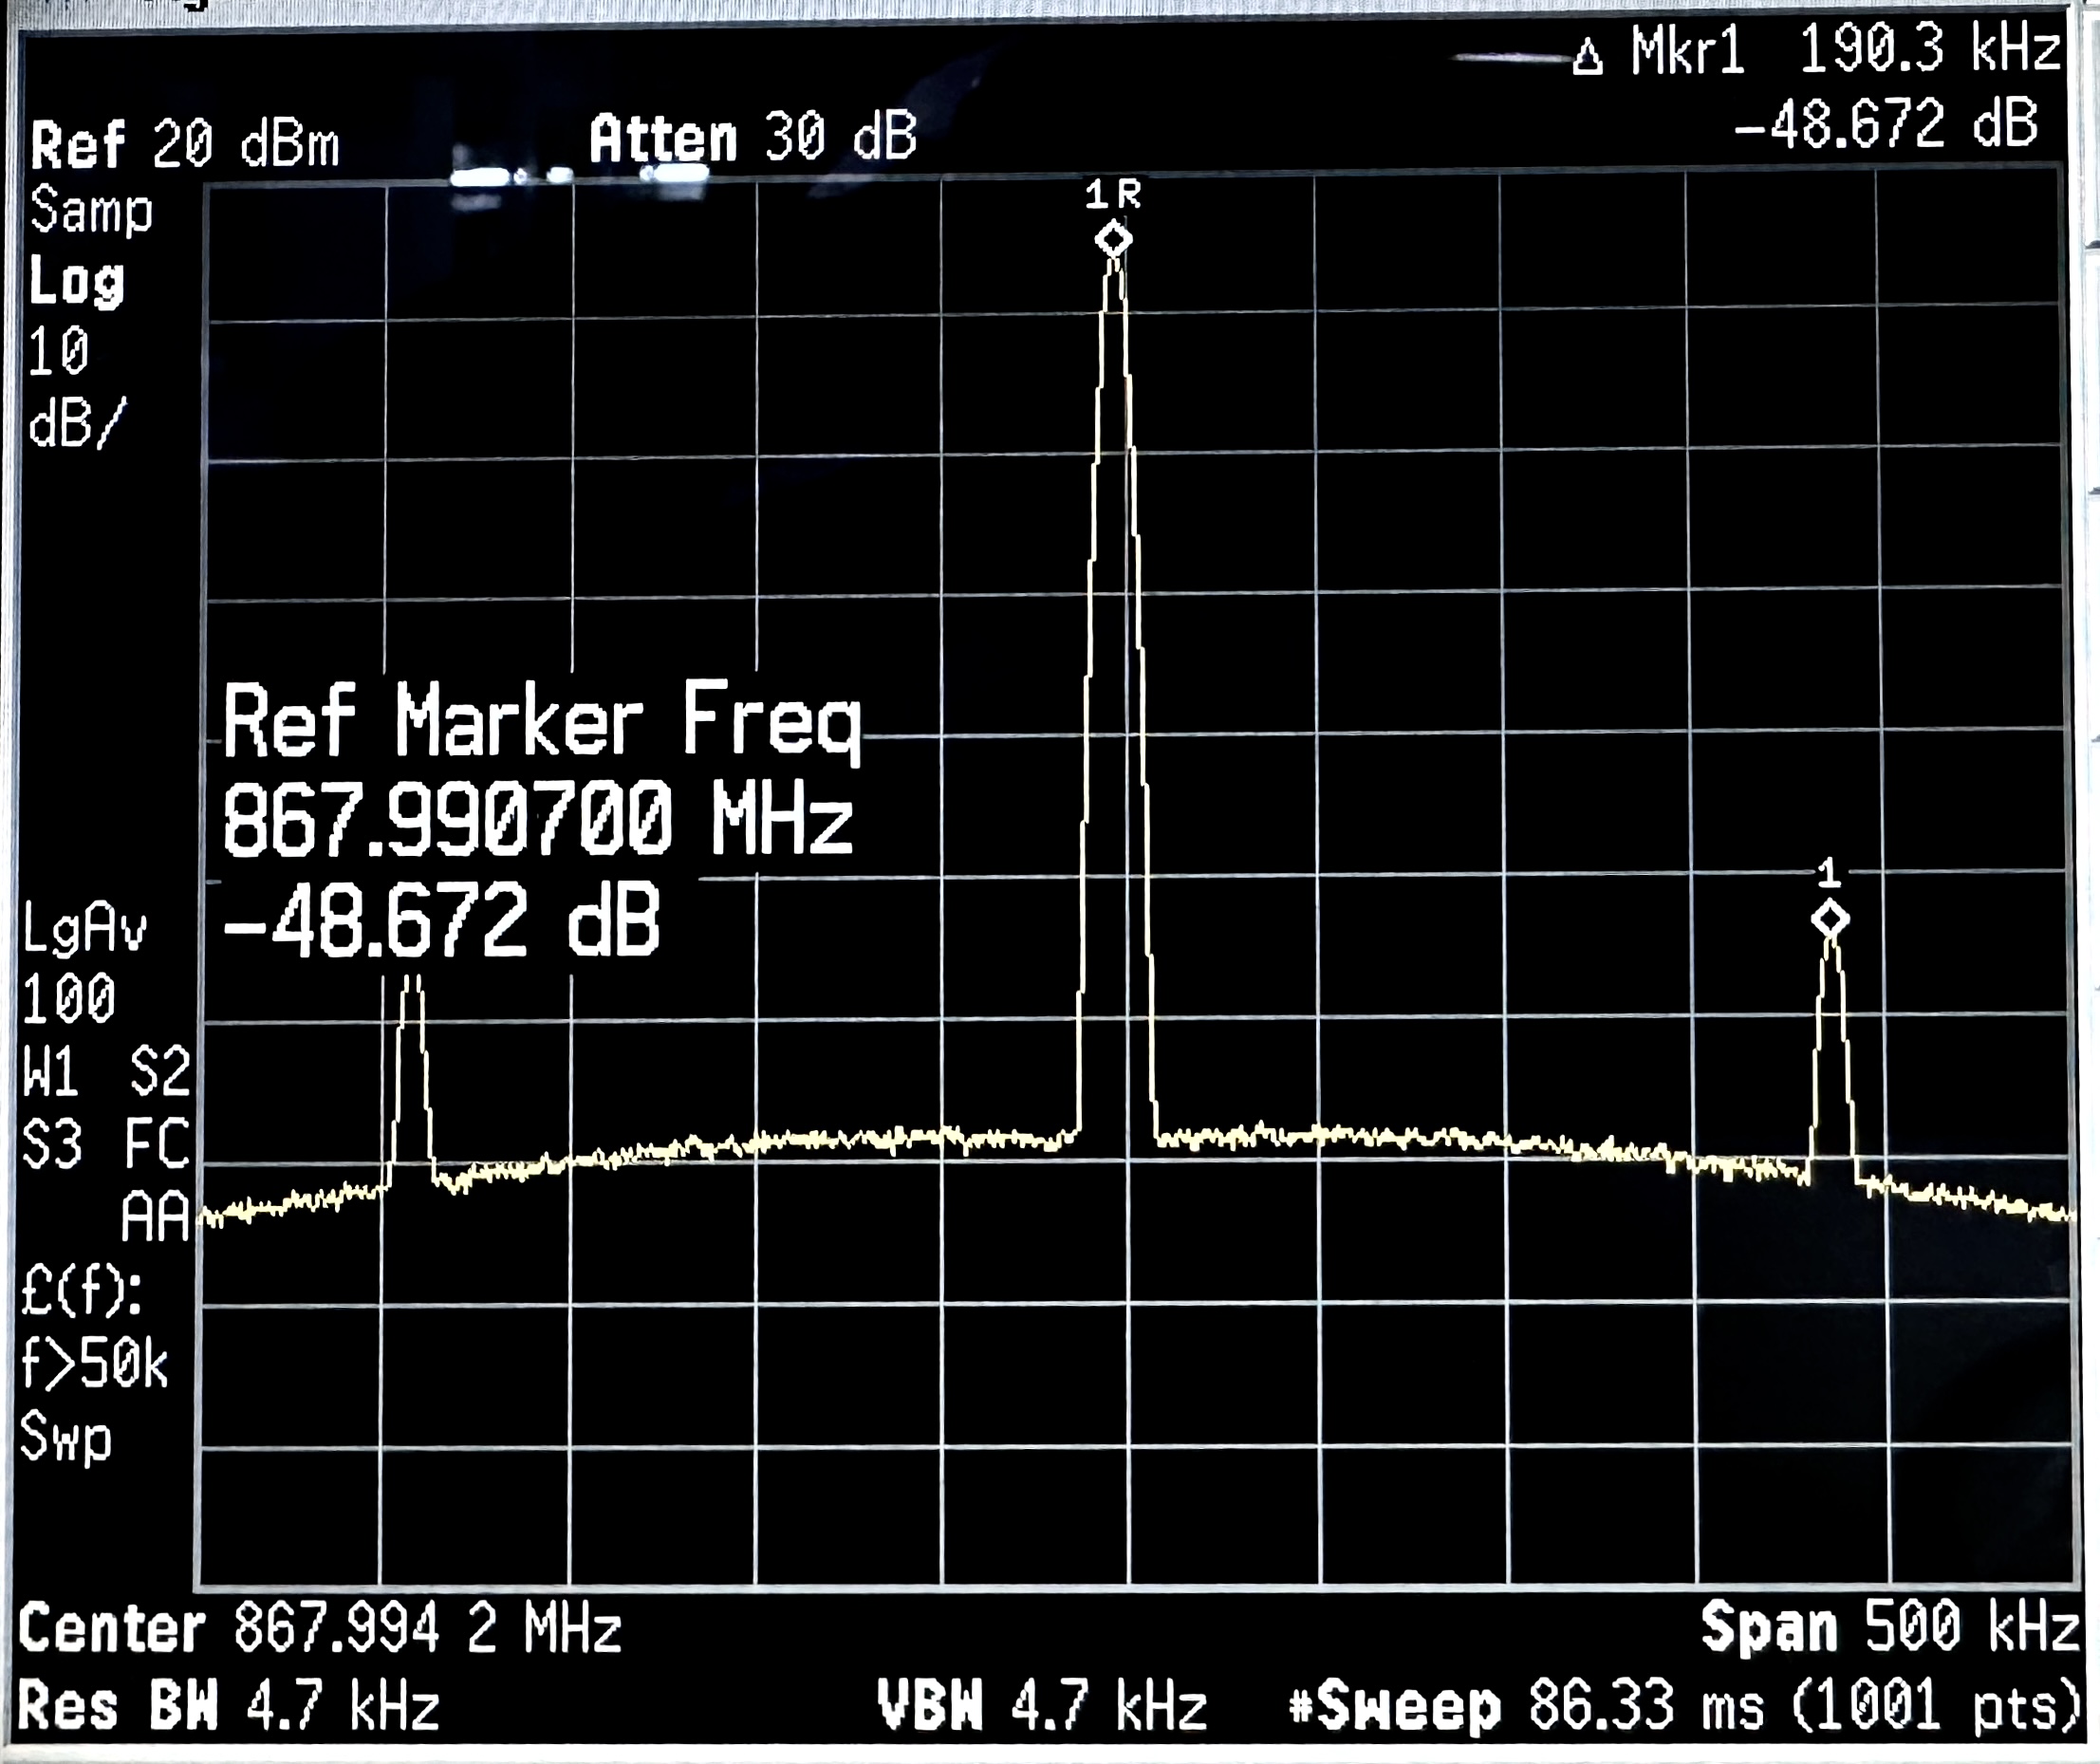 Figure 5-12 LMR36506 Frequency Output With 15dBm Transmission Power at 200kHz Switching Frequency
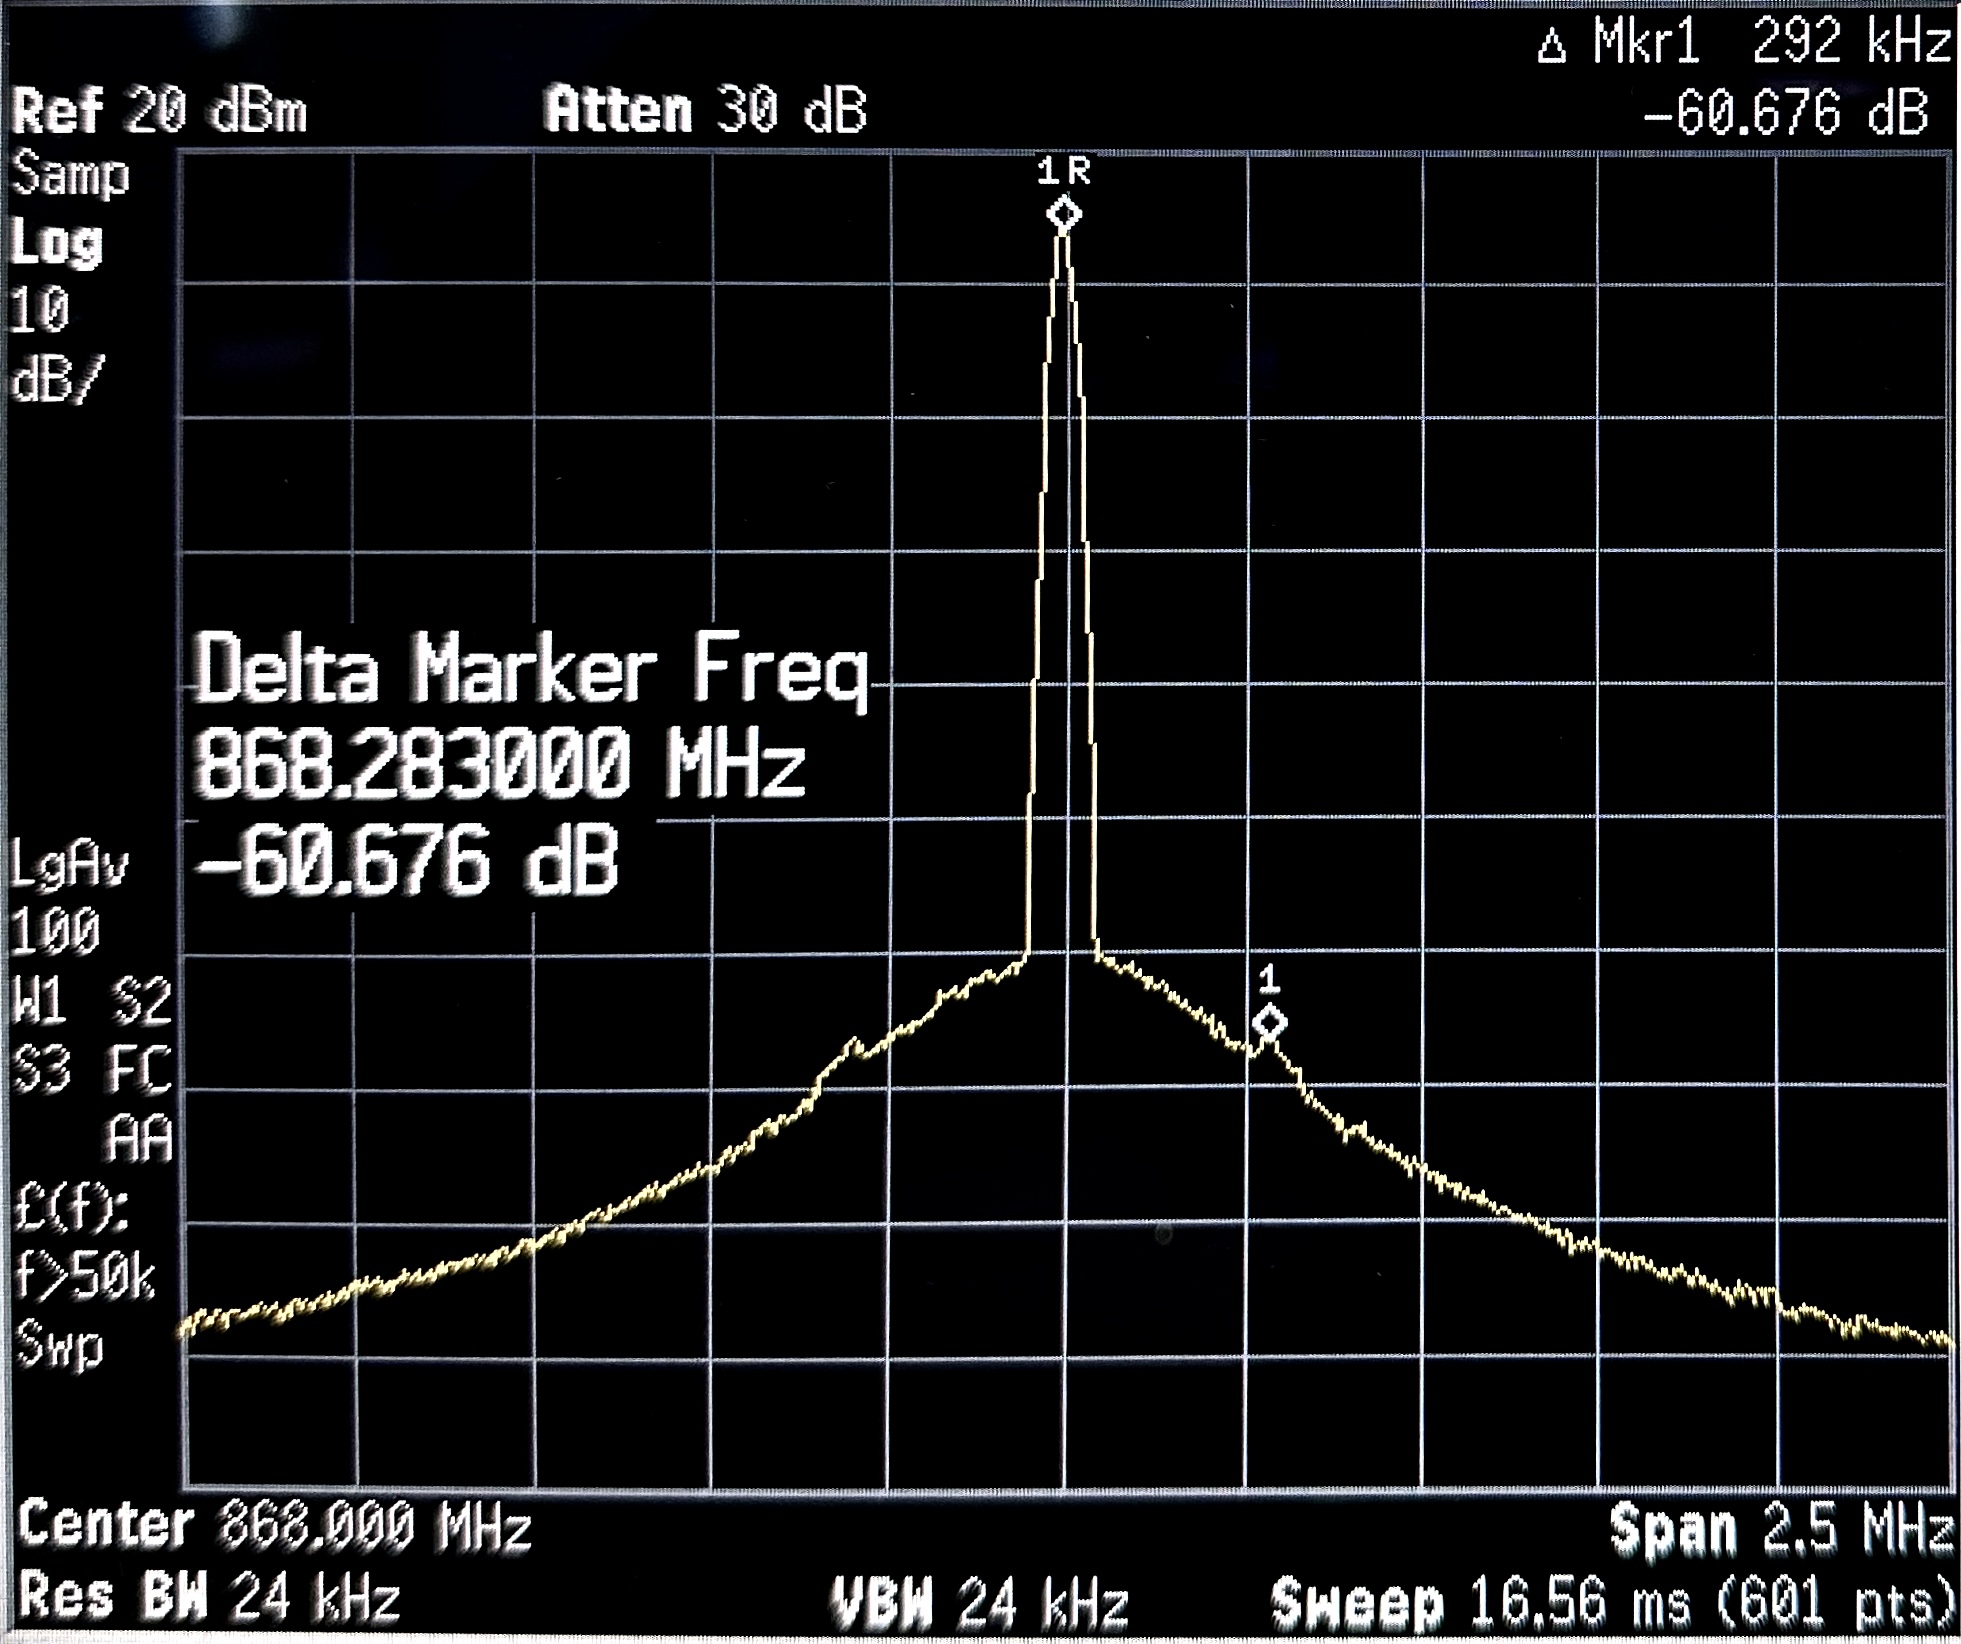 Figure 5-14 LMR36506 Frequency Output With 15dBm Transmission Power at 2MHz Switching Frequency With 2.5MHz Span
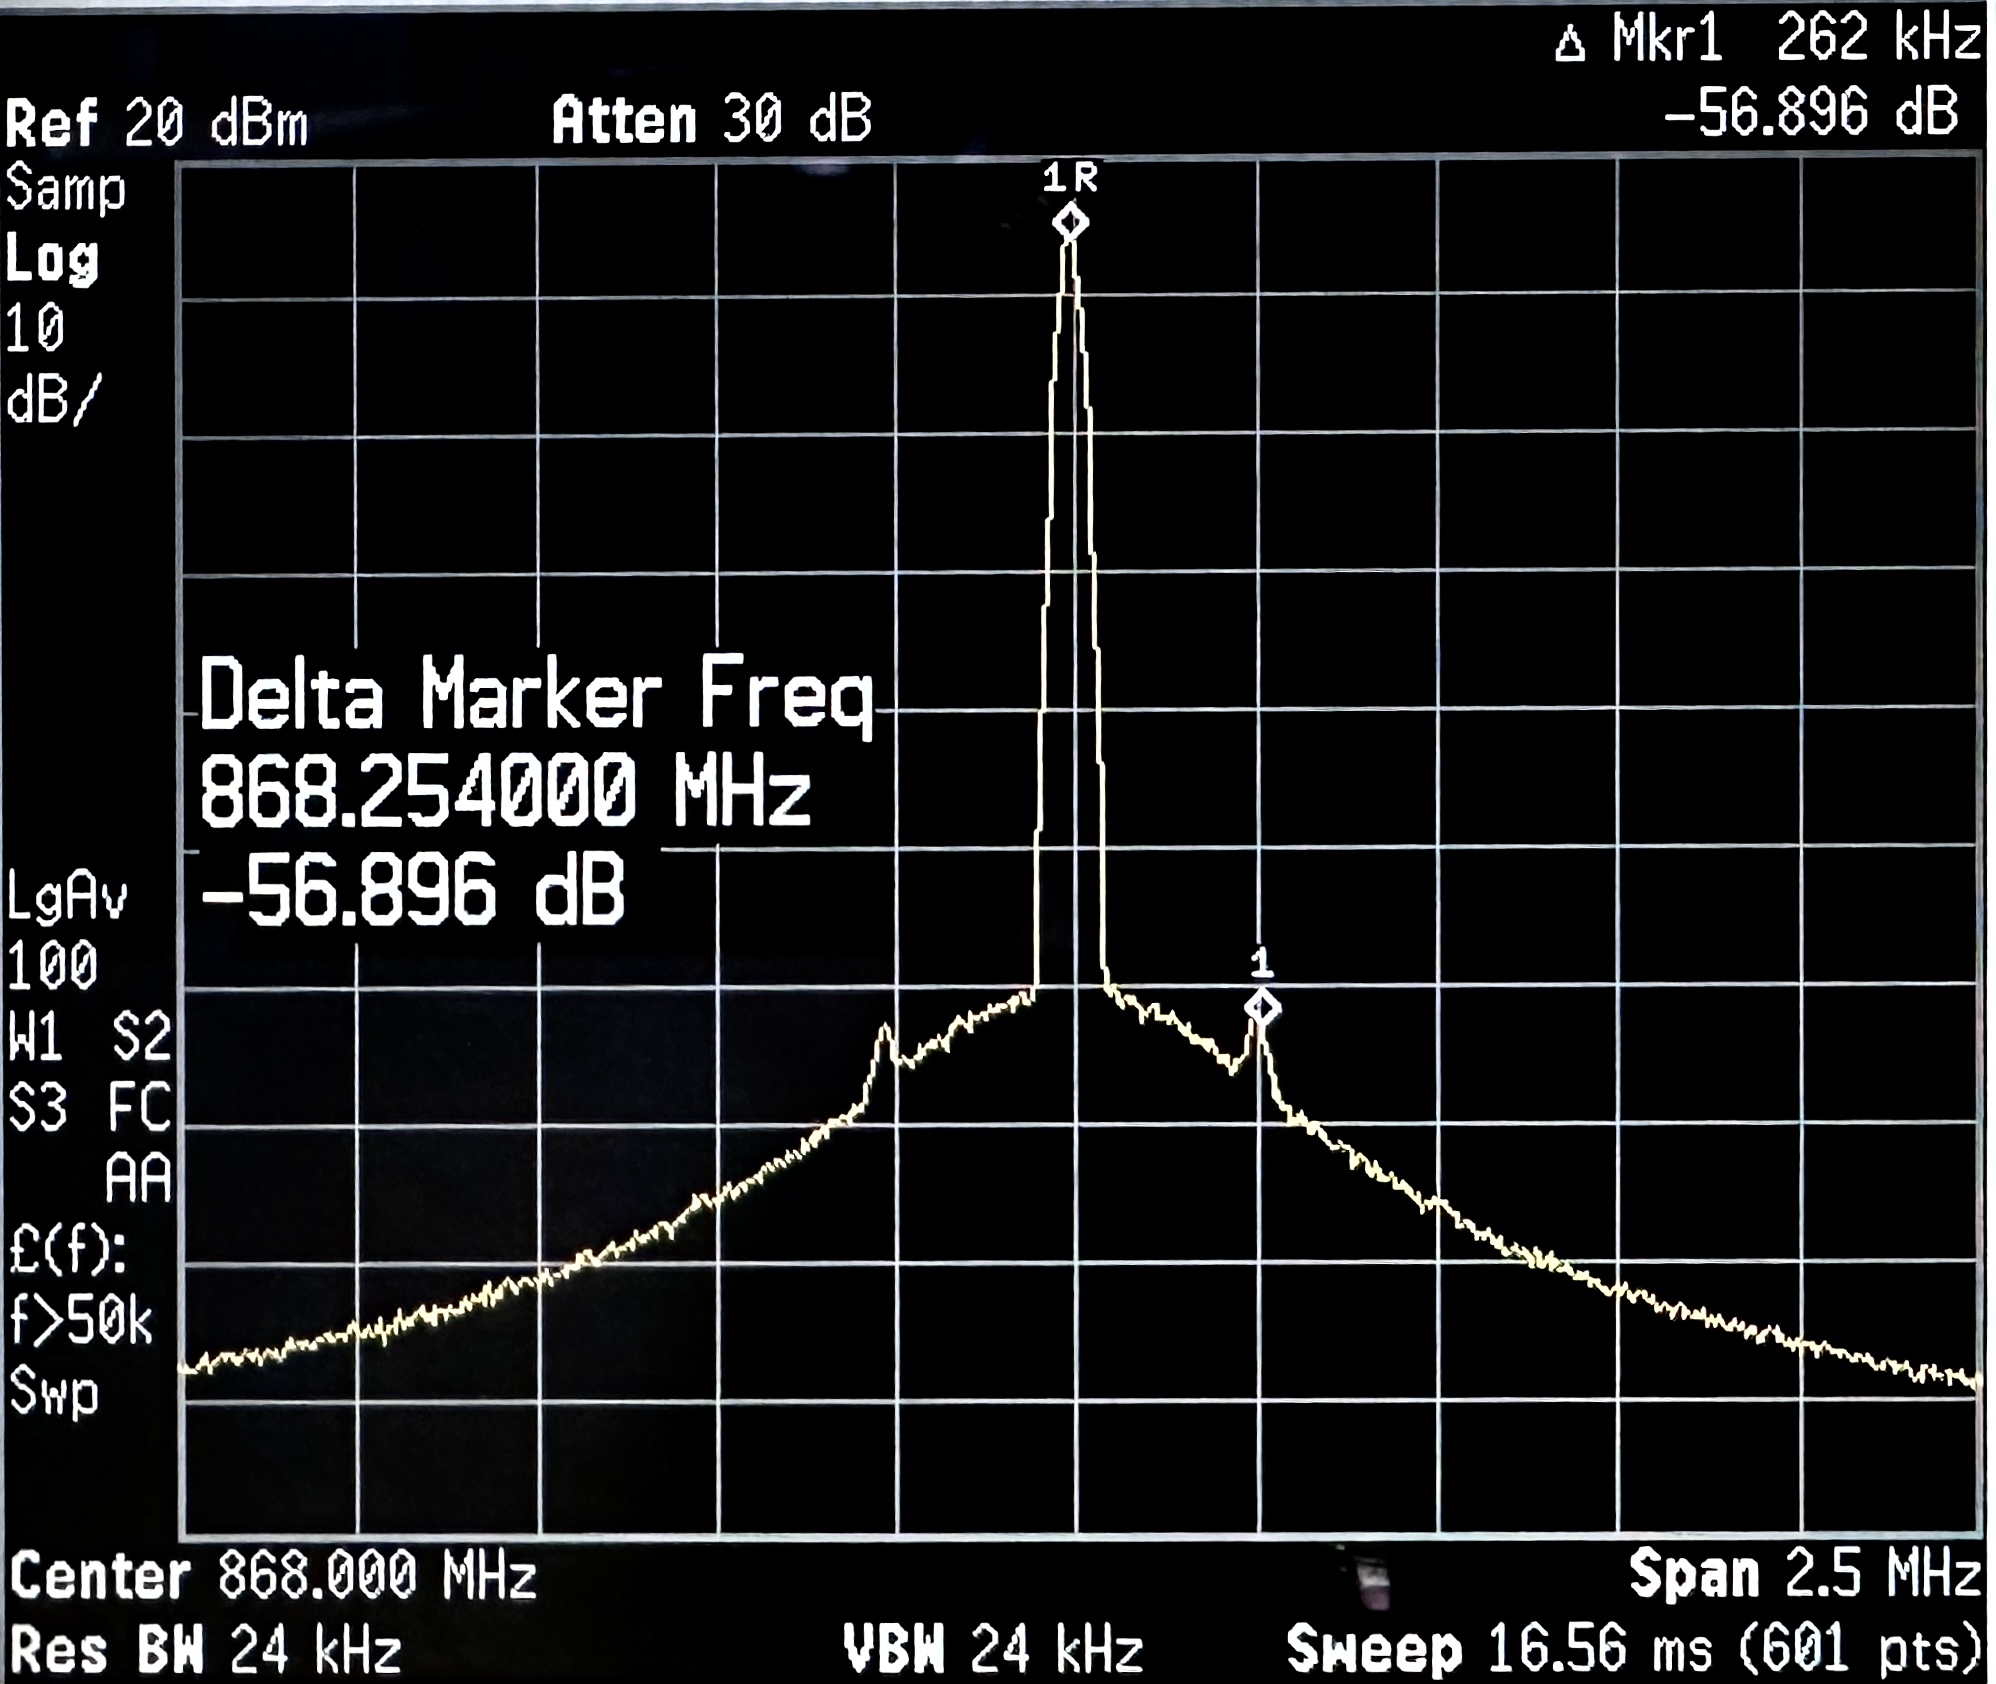 Figure 5-13 LMR36506 Frequency Output With 15dBm Transmission Power at 1MHz Switching Frequency With 2.5MHz Span
Based on the frequency spectrums above, the LMR36510 was seen to have the best performance with respect to reducing spurious emissions as shown in Figure 5-10 and Figure 5-8.