SWRU529C May 2017 – April 2020
-
mmWave Demo Visualizer
- Trademarks
- 1 Setup Instructions
- 2
CONFIGURE Tab
- 2.1 Platform
- 2.2 SDK Version
- 2.3 Antenna Config (Azimuth Resolution - Degrees)
- 2.4 Desirable Configuration
- 2.5 Frequency Band (GHz)
- 2.6 Scene Selection – Best Range Resolution
- 2.7 Scene Selection – Best Velocity Resolution
- 2.8 Scene Selection – Best Range
- 2.9 Plot Selection
- 2.10 User Selected Configuration
- 3 PLOTS Tab
- 4 Advanced Options
- 5 Troubleshooting
- 6 Customizing the mmWave Demo Visualizer
- 7 Offline Version of the Visualizer
- Revision History
3.4 CPU Load
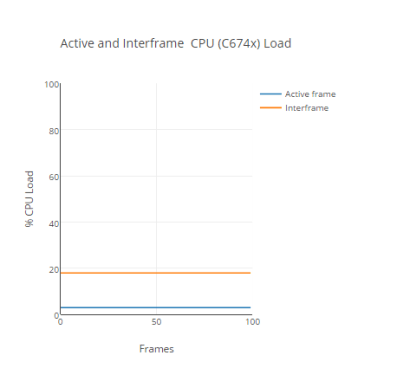
This plot displays the CPU load for the data processing chain during the active or chirping section of a given frame/subframe and during the nonactive or interframe/intersubframe section of the frame/subframe (see Figure 12). The CPU load is expressed as a percentage of these active and inactive durations and therefore varies for a given profileCfg, but with a different frame rate. For xWR14xx devices, this plot shows the CPU load for the Cortex®-R4F. For xWR16xx devices, this plot shows the CPU load for the C674x DSP core (where data path processing happens). For the advanced frame, this plot shows the CPU load for the first subframe, which has this plot enabled in the guiMonitor command (the plot title reflects this subframe number).
NOTE
Select Statistics in the Configure tab and configure the device accordingly to view this plot.
 Figure 12. CPU Load for Frame Rate = 30 fps (Example)