SWRU529C May 2017 – April 2020
-
mmWave Demo Visualizer
- Trademarks
- 1 Setup Instructions
- 2
CONFIGURE Tab
- 2.1 Platform
- 2.2 SDK Version
- 2.3 Antenna Config (Azimuth Resolution - Degrees)
- 2.4 Desirable Configuration
- 2.5 Frequency Band (GHz)
- 2.6 Scene Selection – Best Range Resolution
- 2.7 Scene Selection – Best Velocity Resolution
- 2.8 Scene Selection – Best Range
- 2.9 Plot Selection
- 2.10 User Selected Configuration
- 3 PLOTS Tab
- 4 Advanced Options
- 5 Troubleshooting
- 6 Customizing the mmWave Demo Visualizer
- 7 Offline Version of the Visualizer
- Revision History
3.8.1 Profiling Parameters
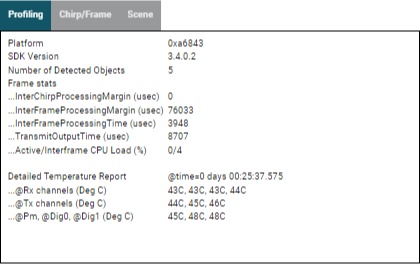
When this display tab is selected, the screen shows the following information (see Figure 16).
- Platform: the hexadecimal string that is output by the mmWave sensor device.
- SDK version: the version of the software that is currently running on the mmWave sensor device.
- Number of Detected Objects: a continuously updating field (new measurement every frame) that shows the number of detected objects for a given frame.
- Frame Stats or Stats for Subframe: In the case of advanced frame configuration, this lists the subframes (separated by command) for which the following stats are displayed. In the case of legacy frame configuration, there is only one construct of the frame and the following stats apply for the whole frame.
- InterChirpProcessingMargin: a continuously updating field (new measurement every frame) that shows the time, in microseconds, that is left in a given (chirp + interchirp) duration after the chirp processing. The field has the value that is the average value across all chirps in a given frame, or values separated by commas which are the average value across all chirps in a given subframe.
- InterFrameProcessingMargin: a continuously updating field (new measurement every frame) that shows the time, in microseconds, that is left in a given frame/subframe after all the frame/subframe processing is completed.
- InterFrameProcessingTime: a continuously updating field (new measurement every frame) that shows the time, in microseconds, that was consumed for frame/subframe processing after the active chirps were completed.
- TransmitOutputTime: a continuously updating field (new measurement every frame) that shows the time, in microseconds, for the requested output (controlled using the selections in the Plot Selection section of the Configure tab) to be shipped out over the UART from the mmWave device to the PC.
- Active/Interframe CPU Load (%): a continuously updating field (new measurement every frame) that shows the percentage CPU load during active chirping time within the frame/subframe and the interframe/intersubframe time. These values are also reflected on the CPU Load plot for the frame, or the first selected subframe in the guiMonitor command.
- Temperature Report: This section displays the device temperature report from various temperature sensors. The time shown is number of days/hours/minutes/seconds/milliseconds since the device was powered up.
 Figure 16. Display Parameters – Profiling