SWRU587A November 2021 – March 2023 AWR2944
- Trademarks
- 1Setup Instructions
-
2CONFIGURE Tab
- 2.1 Platform
- 2.2 SDK Version
- 2.3 Antenna Config (Azimuth Resolution - Degrees)
- 2.4 Processing Chain
- 2.5 Desirable Configuration
- 2.6 Frequency Band (GHz)
- 2.7 Scene Selection – Best Range Resolution
- 2.8 Scene Selection – Best Velocity Resolution
- 2.9 Scene Selection – Best Range
- 2.10 Plot Selection
- 2.11 User Selected Configuration
- 3PLOTS Tab
- 4Advanced Options
- 5Troubleshooting
- 6Customizing the mmWave Demo Visualizer
- Revision History
3.5 Range-Doppler Heatmap
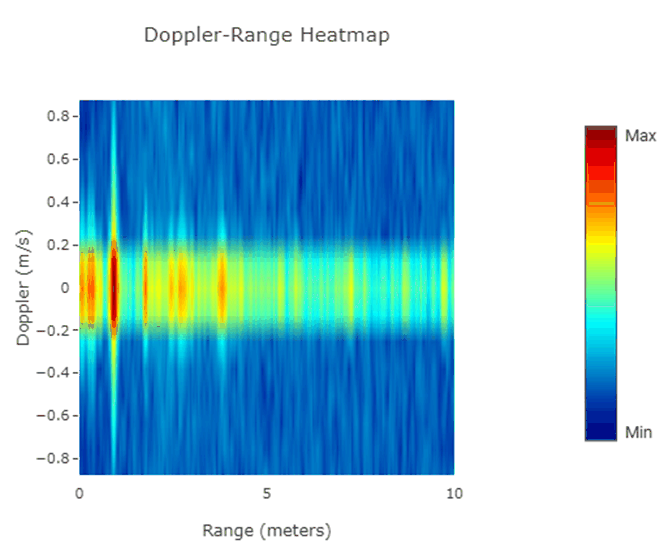
This plot displays the entire radar cube matrix in Range and Doppler coordinates using the heatmap plot (see Figure 3-7). For the advanced frame, this plot shows the heatmap for the first subframe which has this plot enabled in the guiMonitor command (the plot title reflects this subframe number). When the range Bias is supplied using the compRangeBiasAndRxChanPhase command, the GUI internally uses the range bias to correct the range in meters, as calculated from rangeIdx, shipped by the mmWave device.
Note: Select Range Doppler Heat Map in
the Configure tab and configure the device accordingly to view this plot.
 Figure 3-7 Doppler Range Heatmap