SWRU587A November 2021 – March 2023 AWR2944
- Trademarks
- 1Setup Instructions
-
2CONFIGURE Tab
- 2.1 Platform
- 2.2 SDK Version
- 2.3 Antenna Config (Azimuth Resolution - Degrees)
- 2.4 Processing Chain
- 2.5 Desirable Configuration
- 2.6 Frequency Band (GHz)
- 2.7 Scene Selection – Best Range Resolution
- 2.8 Scene Selection – Best Velocity Resolution
- 2.9 Scene Selection – Best Range
- 2.10 Plot Selection
- 2.11 User Selected Configuration
- 3PLOTS Tab
- 4Advanced Options
- 5Troubleshooting
- 6Customizing the mmWave Demo Visualizer
- Revision History
3.3 Range Profile
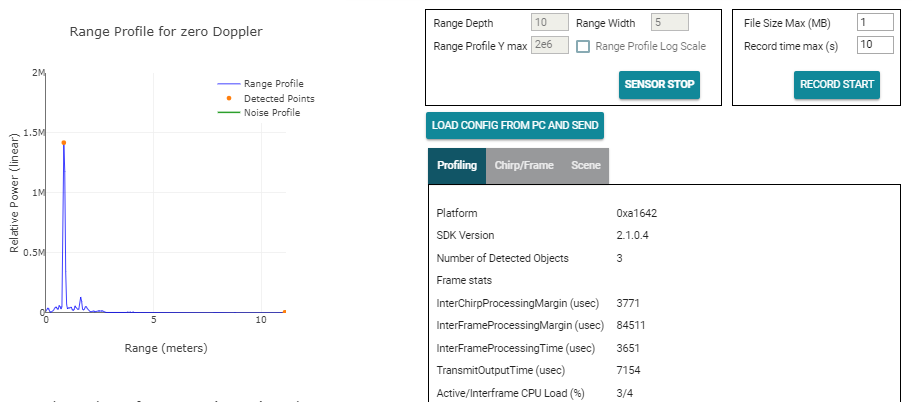
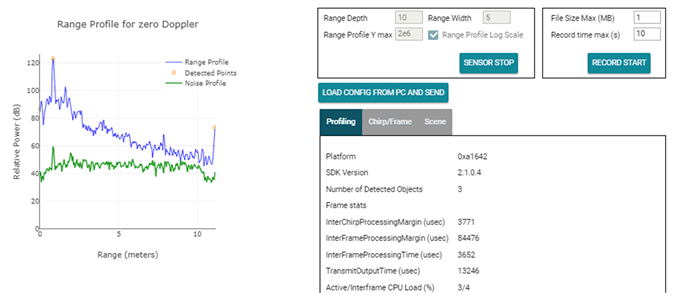
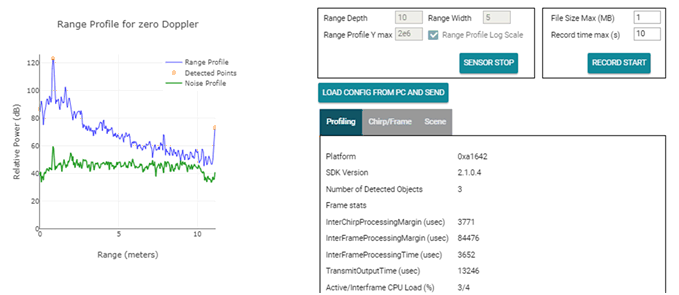
This plot shows the range profile at the 0th Doppler (static objects) using the blue line and noise profile (if enabled) using green line (see Figure 3-5). By default, this graph shows the log values. The detected objects in the 0th Doppler range bin are shown as orange cross marks over the blue Range Profile plot line (see Figure 3-3 and Figure 3-4). For the advanced frame, this plot shows the range profile for the first subframe, which has this plot enabled in the guiMonitor command (the plot title reflects this subframe number). When the range bias is supplied using the compRangeBiasAndRxChanPhase command, the GUI internally uses the range bias to correct the range in meters, as calculated from rangeIdx, shipped by the mmWave device. The range and noise profile sent by the mmWave device is compensated for all the 1D and 2D FFT gains and the incoherent combining gain across the antennas, as per the mmWave demo processing chain, before plotting.
The linear scale for the Y-axis can be selected by unchecking the Range Profile Log Scale checkbox. The maximum limit for the Y-axis in the linear domain can be selected by the user with the Range Profile Y-max text box. Use the stop button to stop plotting and then you can change these settings. Once the settings are changed, resume plotting using the start button.
 Figure 3-3 Range Profile in Linear
Scale
 Figure 3-4 Range Profile in Log
Scale
 Figure 3-5 Range and Noise Profile in Log
Scale