TIDT179A may 2020 – april 2023
2.5 Thermal Images
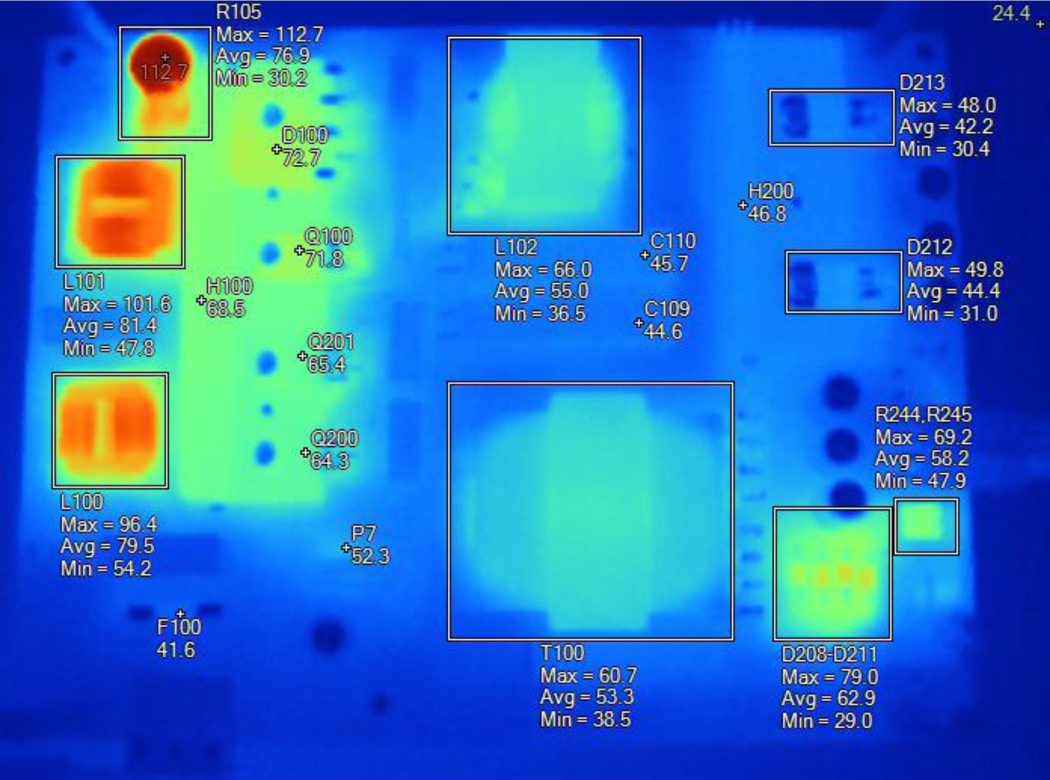
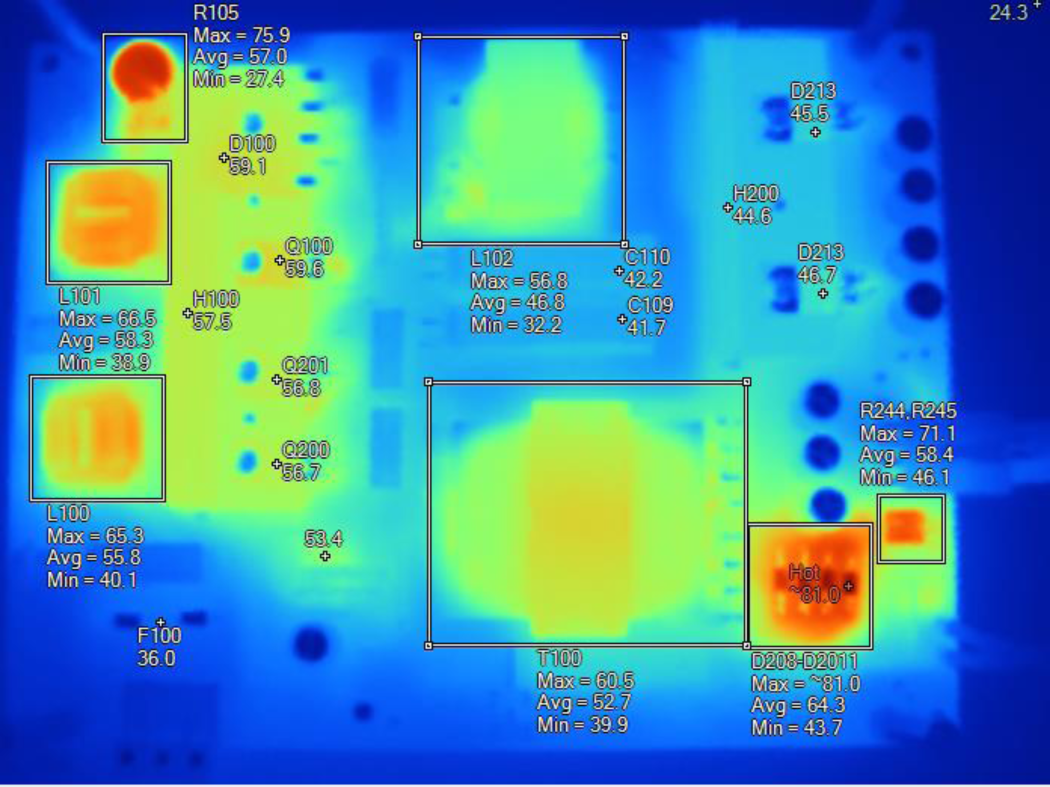
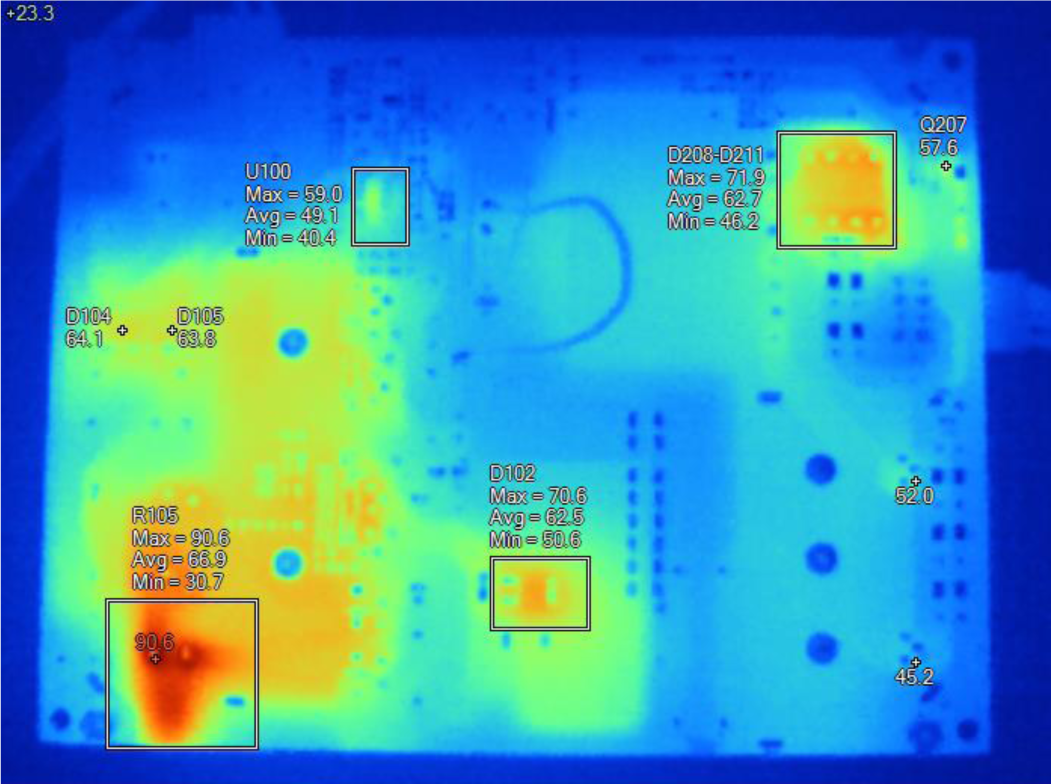
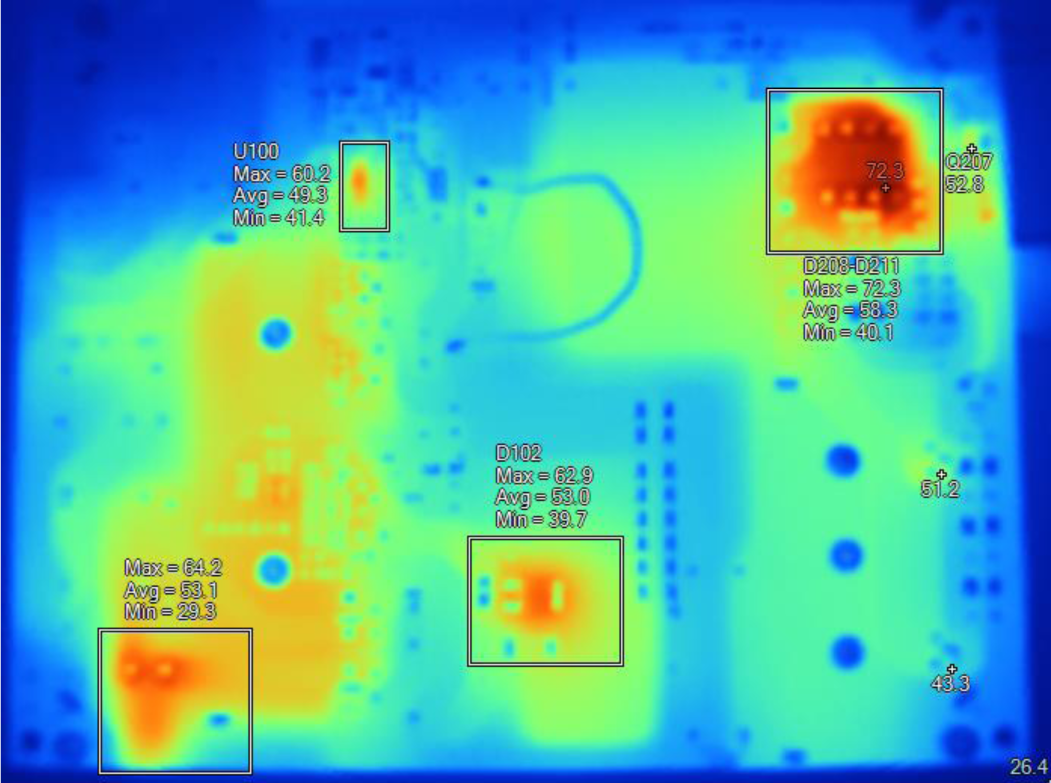
The thermal images below show a top view and bottom view of the board. The ambient temperature was 25ºC with no air flow. The input voltage was 115Vac/60Hz and 230Vac/50Hz, the outputs were full loaded with 2 hours soak time.
 Figure 2-3 Top Side Thermal View
@115Vac/60Hz, Full Loaded
 Figure 2-5 Top Side Thermal View
@230Vac/50Hz, Full Loaded
 Figure 2-4 Bottom Side Thermal View
@115Vac/60Hz, Full Loaded
 Figure 2-6 Bottom Side Thermal View
@230Vac/50Hz, Full Loaded
Figure 2-6 Bottom Side Thermal View
@230Vac/50Hz, Full LoadedTable 2-1 Main Image Markers
| Name | Temperature @115Vac | Temperature @230Vac | Emissivity | Background |
|---|---|---|---|---|
| L100 | 96.4°C | 65.3°C | 0.96 | 25°C |
| L101 | 101.6°C | 66.5°C | 0.96 | 25°C |
| L102 | 66.0°C | 56.8°C | 0.96 | 25°C |
| T100 | 60.7°C | 60.5°C | 0.96 | 25°C |
| D100 | 72.7°C | 59.1°C | 0.96 | 25°C |
| D102 | 70.5°C | 62.9°C | 0.96 | 25°C |
| R105 | 112.7°C | 75.9°C | 0.96 | 25°C |
| Q100 | 71.8°C | 59.6°C | 0.96 | 25°C |
| Q200 | 65.4°C | 56.8°C | 0.96 | 25°C |
| Q201 | 64.3°C | 56.7°C | 0.96 | 25°C |