TIDT205 February   2021


  1. 1Description
  2. 2Test Prerequisites
    1. 2.1 Voltage and Current Requirements
    2. 2.2 Considerations
    3. 2.3 Dimensions
  3. 3Testing and Results
    1. 3.1 Efficiency Graphs
    2. 3.2 Efficiency Data
    3. 3.3 Load Regulation
    4. 3.4 Thermal Image
    5. 3.5 Bode Plots
    6. 3.6 Conducted Emissions Testing (CISPR 25, Class 5)
  4. 4Waveforms
    1. 4.1 Switching
    2. 4.2 Output Voltage Ripple
    3. 4.3 Load Transients
    4. 4.4 Start-up Sequence
    5. 4.5 Termination Sequence

Load Regulation

Load regulation data was extracted from the efficiency measurements.
GUID-20210208-CA0I-V3D7-DBLQ-5WBVLCMPGZXX-low.jpg
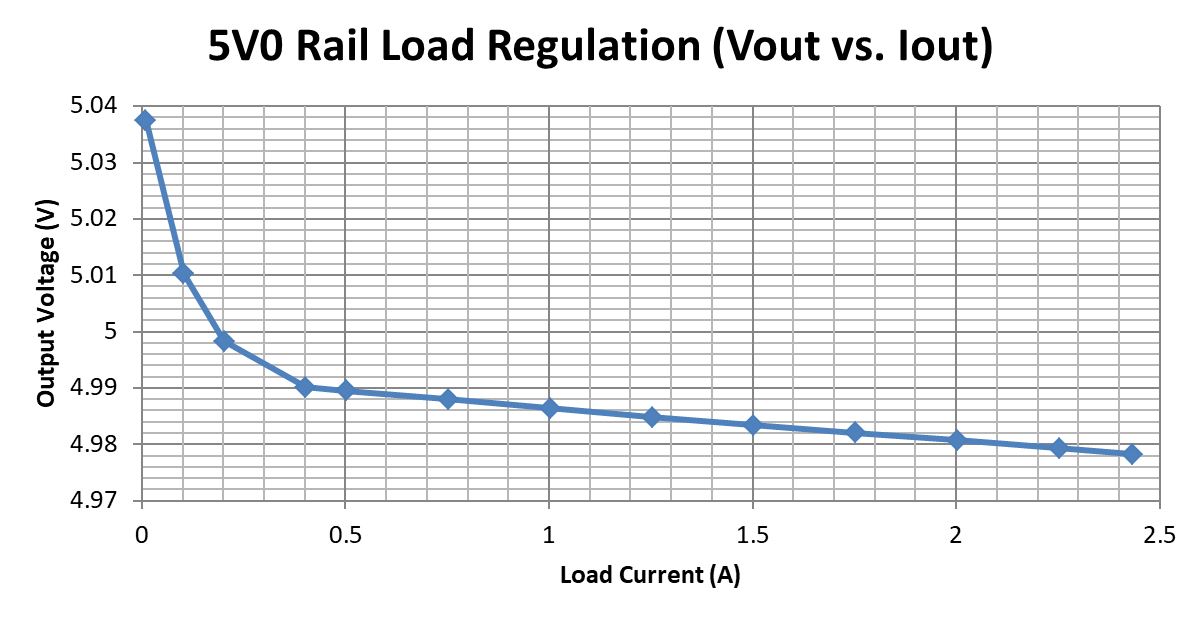
The output voltage is regulated to within 0.76% of the nominal 5 V.
Figure 3-6 Output Voltage vs IOUT (5-V Output).
GUID-20210208-CA0I-HRHM-RQDM-VL0JVKQZ7PFS-low.jpg
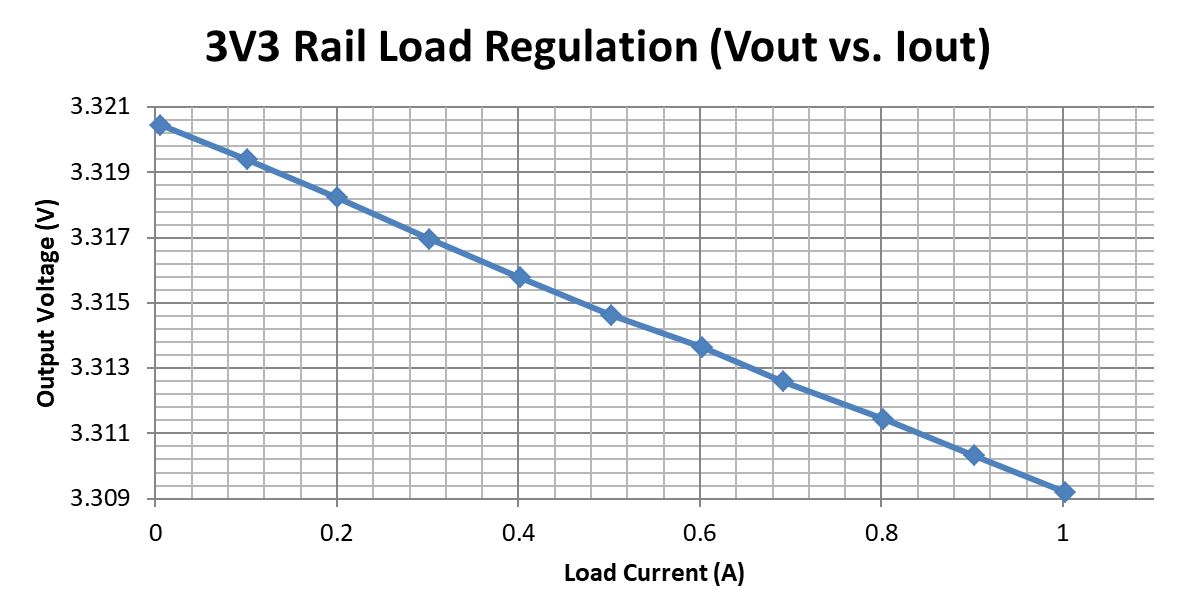
The output voltage is regulated to within 0.62% of the nominal 3.3 V.
Figure 3-7 Output Voltage vs IOUT (3.3-V Output).
GUID-20210208-CA0I-DJPW-FR67-KRSQCLRQHN80-low.jpg
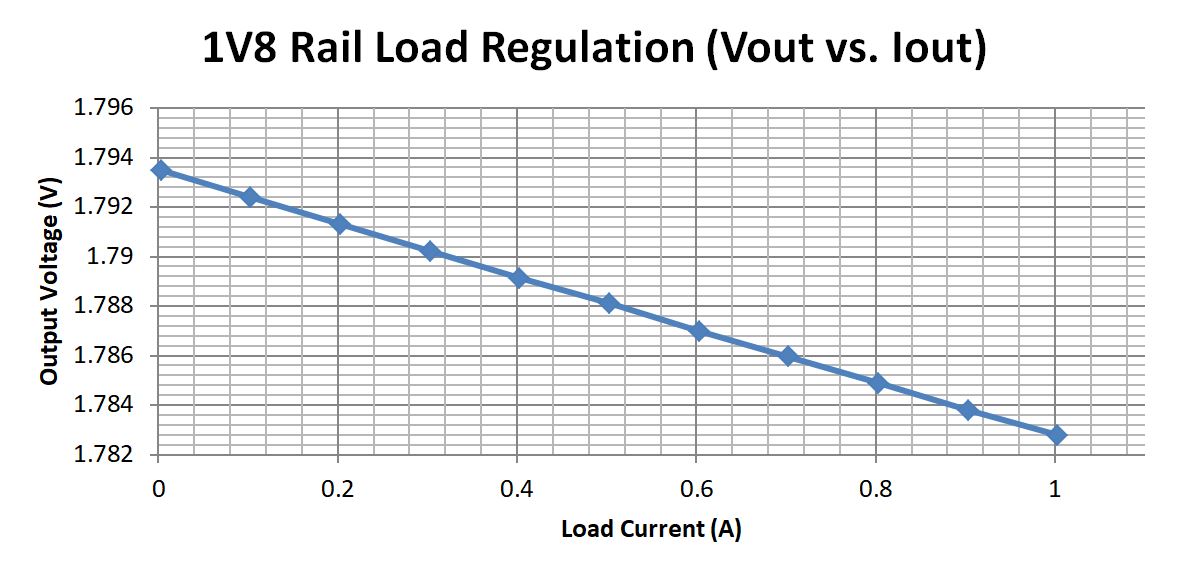
The output voltage is regulated to within 0.96% of the nominal 1.8 V.
Figure 3-8 Output Voltage vs IOUT (1.8-V Output).
GUID-20210208-CA0I-FD5D-KMMZ-LNF67XZQLNS5-low.jpg
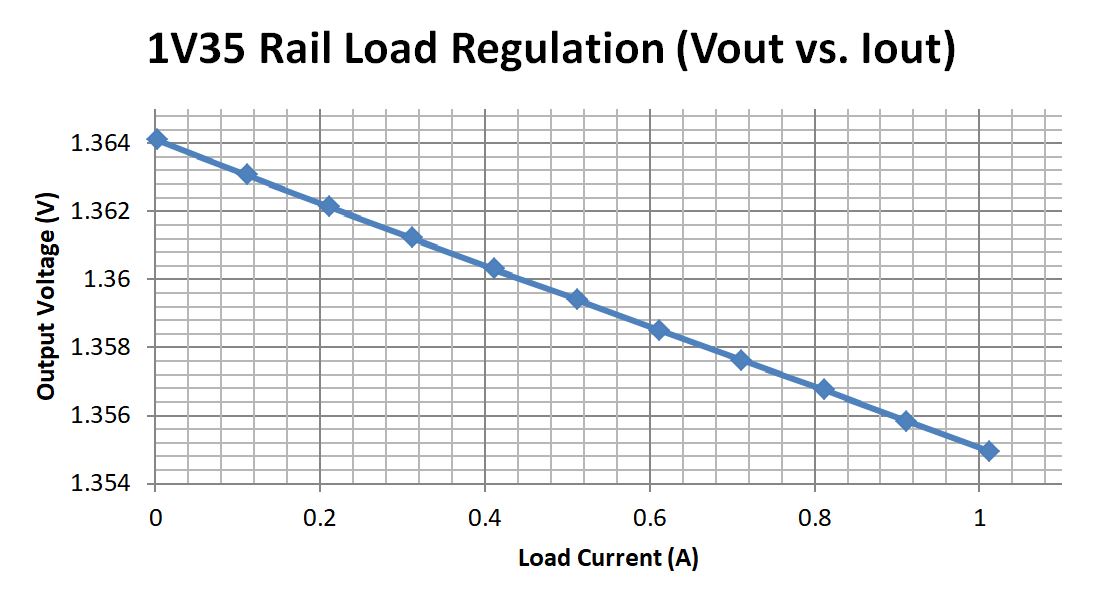
The output voltage is regulated to within 1.04% of the nominal 1.35 V.
Figure 3-9 Output Voltage vs IOUT (1.35-V Output).
GUID-20210208-CA0I-KST7-XQNZ-NV8KPJ6HGTM2-low.jpg
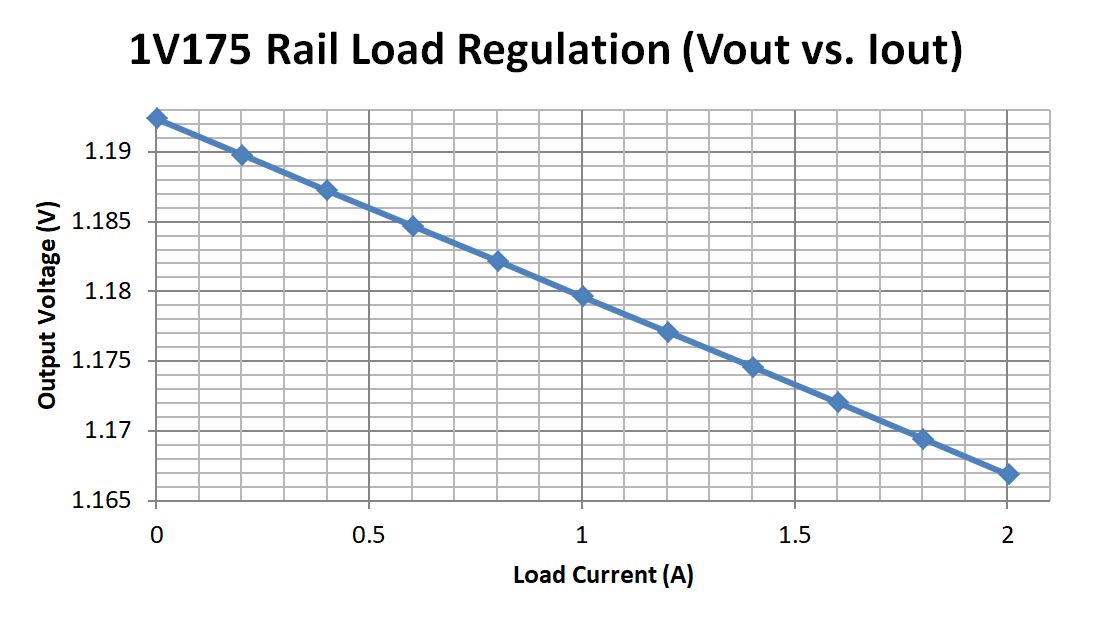
The output voltage is regulated to within 1.48% of the nominal 1.175 V.
Figure 3-10 Output Voltage vs. IOUT (1.175-V Output).