TIDT222 April   2021


  1. 1Description
  2. 2Test Prerequisites
    1. 2.1 Voltage and Current Requirements
    2. 2.2 Required Equipment
    3. 2.3 Considerations
    4. 2.4 Dimensions
    5. 2.5 Test Setup
  3. 3Testing and Results
    1. 3.1 Efficiency and Loss Graphs
    2. 3.2 Efficiency Data
    3. 3.3 Thermal Images
    4. 3.4 Bode Plots
  4. 4Waveforms
    1. 4.1 Switching
    2. 4.2 Output Voltage Ripple
    3. 4.3 Load Transients
    4. 4.4 Start-up Sequence

Switching

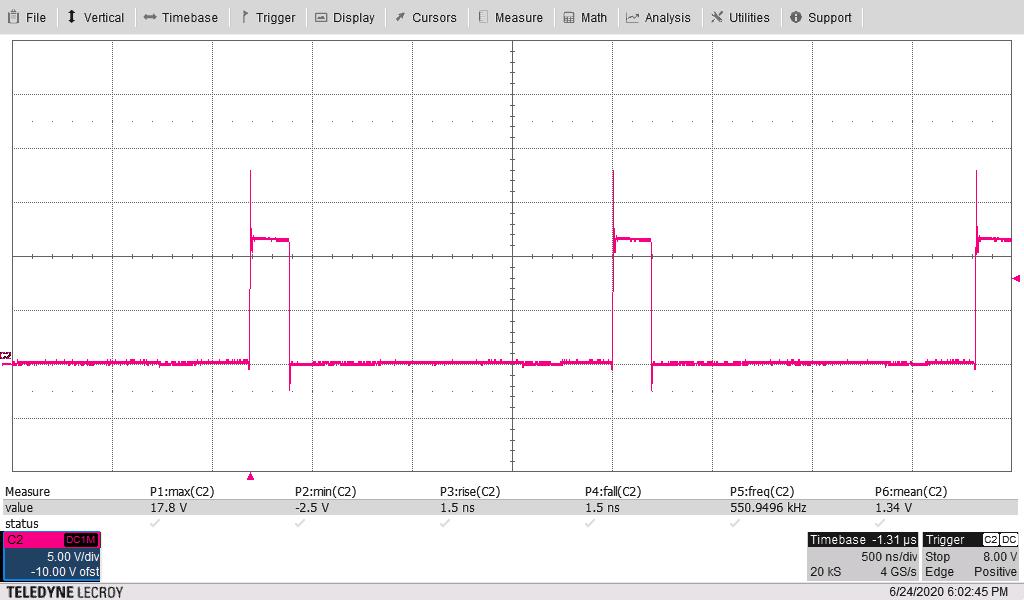
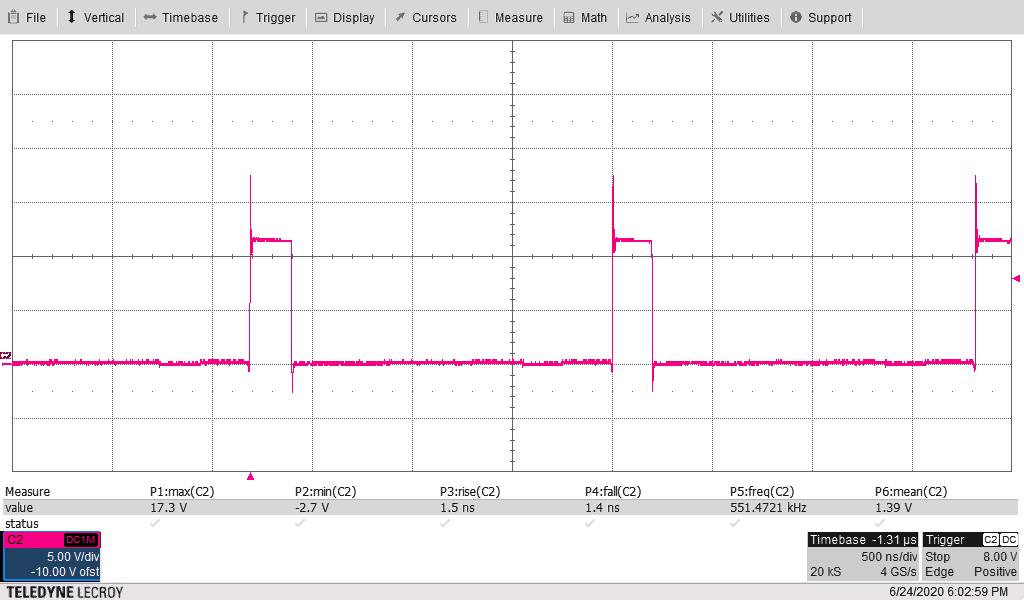
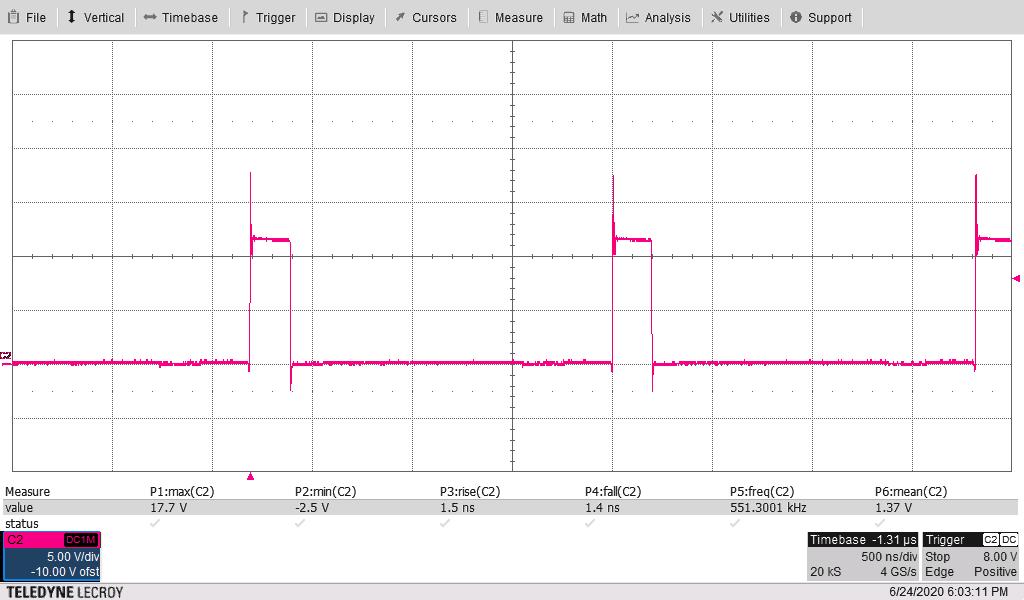
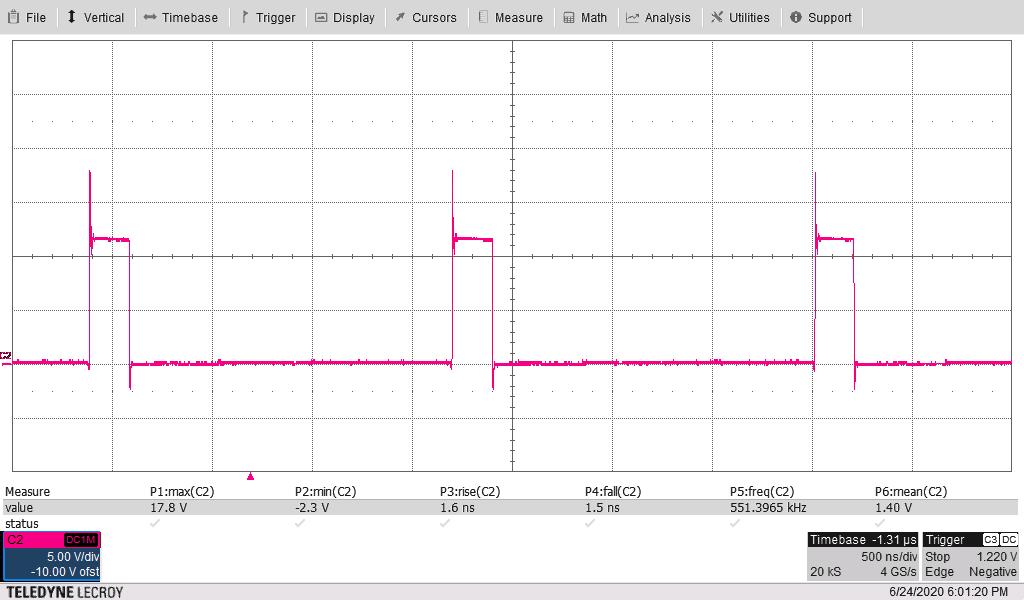
The following images show the switch node voltage of the leader TPS546D24A and the main waveforms on each of the 3 followers. The input voltage is 12 V and the 1.2-V output is loaded to 160 A.

All scopes are taken at 5 V/DIV, 500 ns/DIV, full bandwidth which is 750 MHz for scope and 500 MHz for probe.
GUID-20210105-CA0I-GV0H-C4BK-97FT9QGJ4PJT-low.jpg Figure 4-1 Leader
GUID-20210105-CA0I-CVDR-0CVL-LSNVRV79TLJZ-low.jpg Figure 4-2 Follower 1
GUID-20210105-CA0I-PN2B-NGXR-B1T3MZ0DMCMF-low.jpg Figure 4-3 Follower 2
GUID-20210105-CA0I-J02L-ZVJG-W5T0XWZXPLFJ-low.jpg Figure 4-4 Follower 3