TIDT243 December 2021
7 Load Transients
Figure 7-1 through Figure 7-5 show the scope trace images at load step, 10% to 90% to 10% of maximum output current.
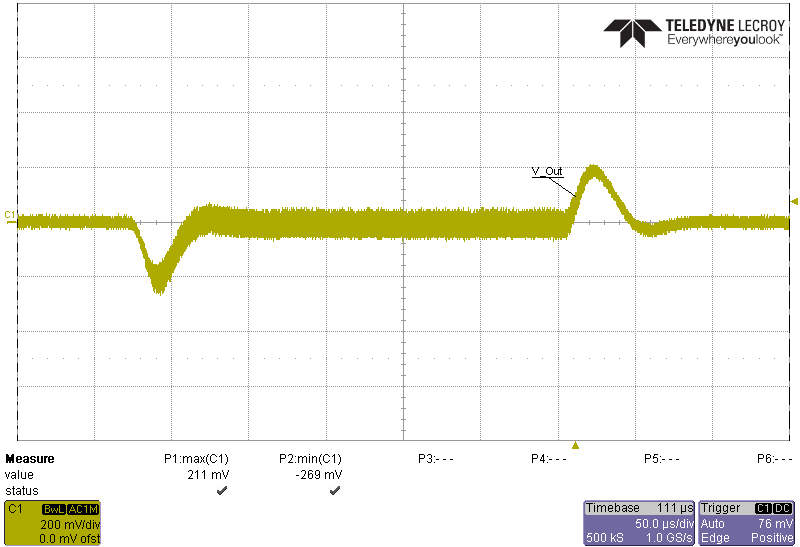 Figure 7-1 Part A – 2.1 MHz
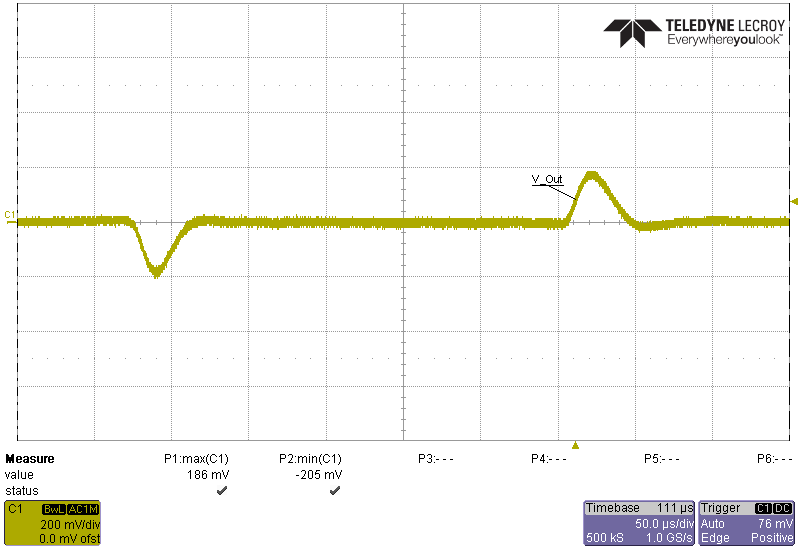 Figure 7-2 Part B – 2.1 MHz
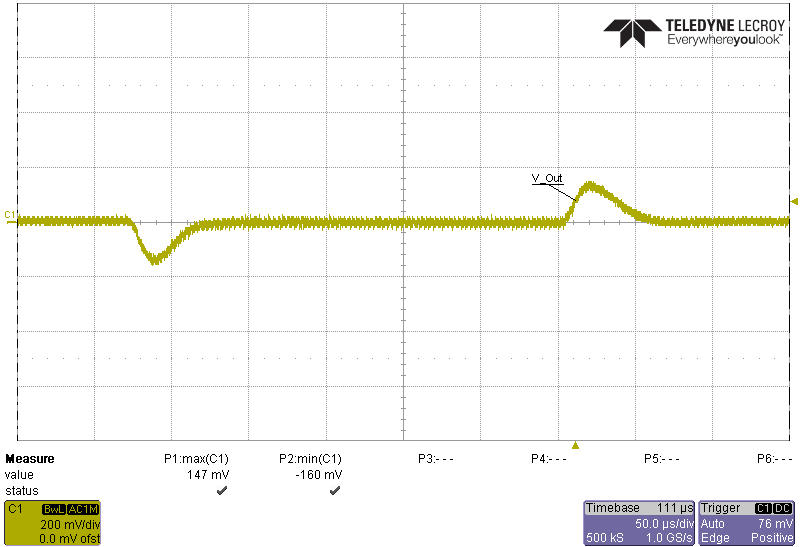 Figure 7-3 Part C – 400 kHz
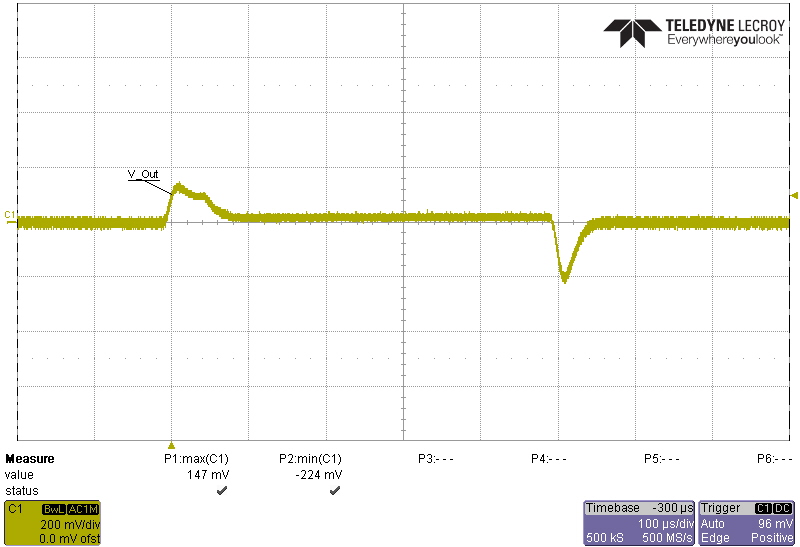 Figure 7-4 Part C – 2.1 MHz
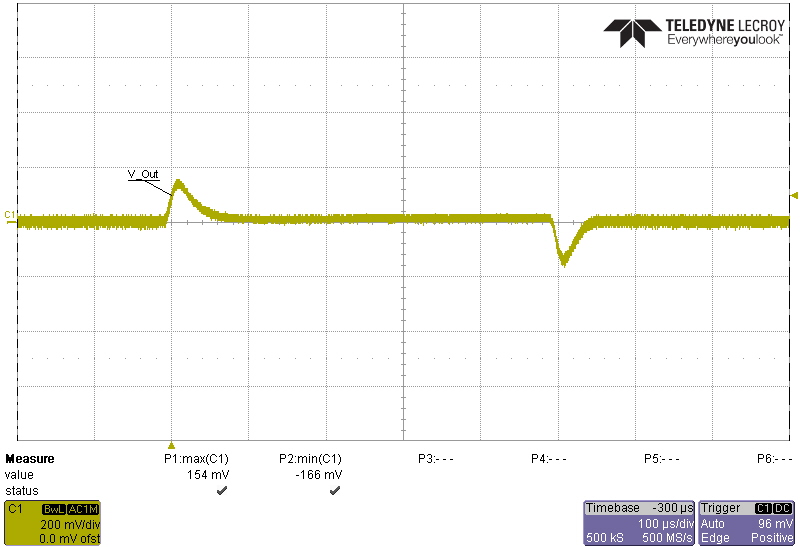 Figure 7-5 Part C – 2.1 MHz, 1 A to 6 A
to 1 A