TIDT290 August   2022


  1.   Description
  2.   Features
  3.   Applications
  4. 1Test Prerequisites
    1. 1.1 Voltage and Current Requirements
    2. 1.2 Required Equipment
  5. 2Testing and Results
    1. 2.1 Efficiency Graphs
    2. 2.2 Efficiency Data
    3. 2.3 Thermal Images
    4. 2.4 Bode Plots
  6. 3Waveforms
    1. 3.1 Switching
    2. 3.2 Output Voltage Ripple
    3. 3.3 Load Transients
    4. 3.4 Start-Up Sequence
    5. 3.5 Shutdown Sequence
    6. 3.6 Input Voltage Ripple

Thermal Images

The thermal images in this section were taken with full load at an ambient temperature of 25°C after 10 minutes.
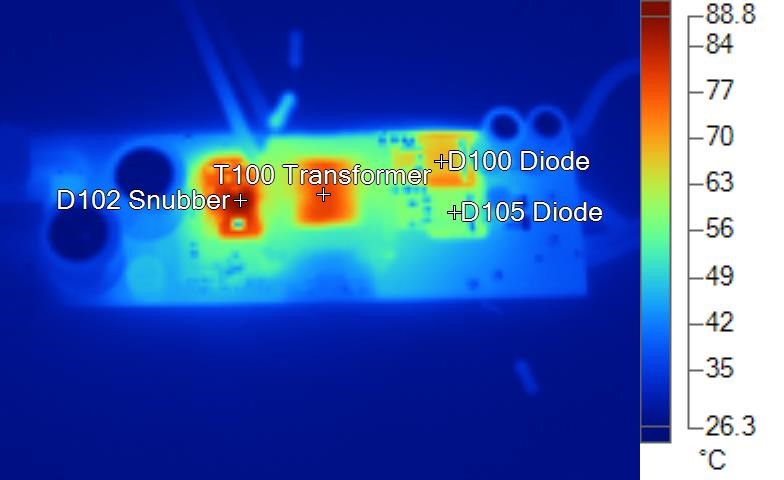
GUID-20220525-SS0I-SRMV-6R2H-XPCD7WZZH41X-low.jpg
Name Temperature
T100 Transformer 79.5°C
D102 Snubber 88.8°C
D100 Diode 68.6°C
D105 Diode 58.1°C
Figure 2-2 230-VAC Input Top Thermal Image
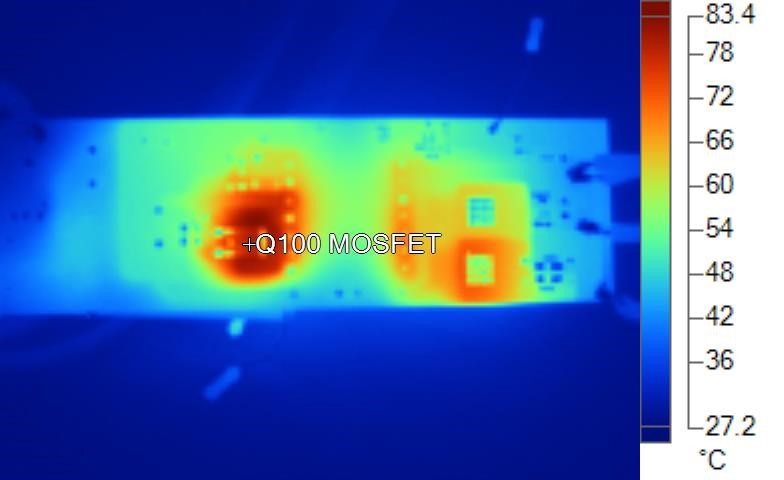
GUID-20220525-SS0I-WQN1-6JJX-MWKTBDJNHZM2-low.jpg
Name Temperature
Q100 MOSFET 79.1°C
Figure 2-3 230-VAC Input Bottom Thermal Image
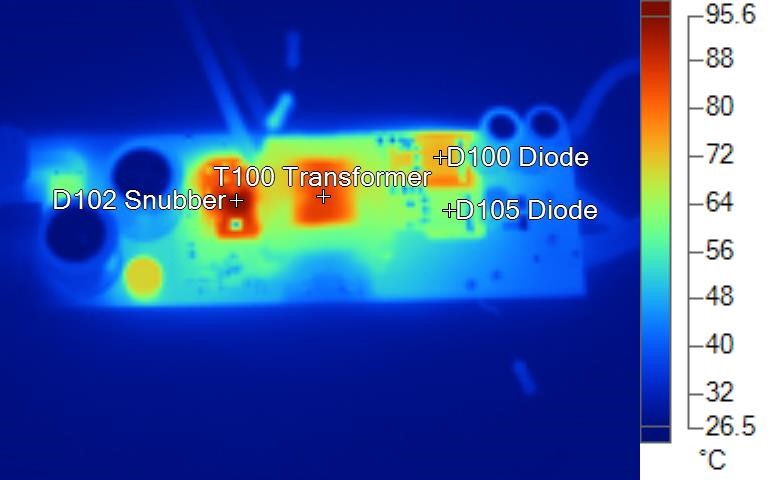
GUID-20220525-SS0I-JQSN-Z4CB-G6VL1244Q5MS-low.jpg
Name Temperature
T100 Transformer 86.1°C
D102 Snubber 95.6°C
D100 Diode 74.4°C
D105 Diode 62.4°C
Figure 2-4 110-VAC Input Top Thermal Image
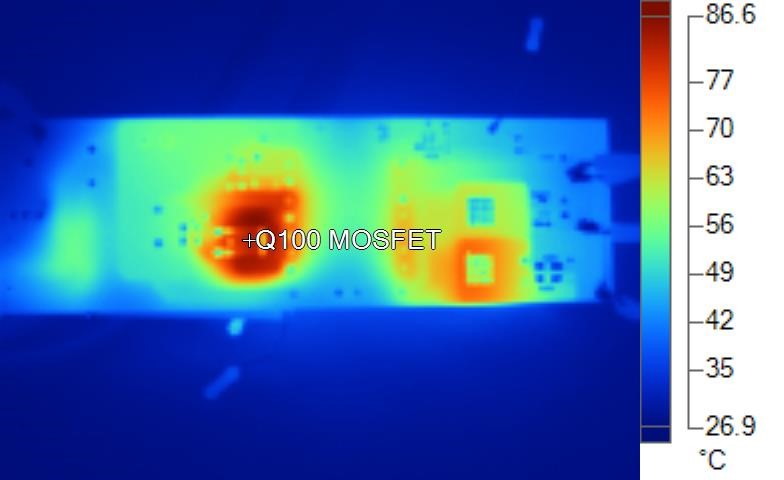
GUID-20220525-SS0I-RWWT-ZSNZ-GRKPZ8DNBLD4-low.jpg
Name Temperature
Q100 MOSFET 82.3°C
Figure 2-5 110-VAC Input Bottom Thermal Image