TIDT381 March 2024
2.5 Bode Plots
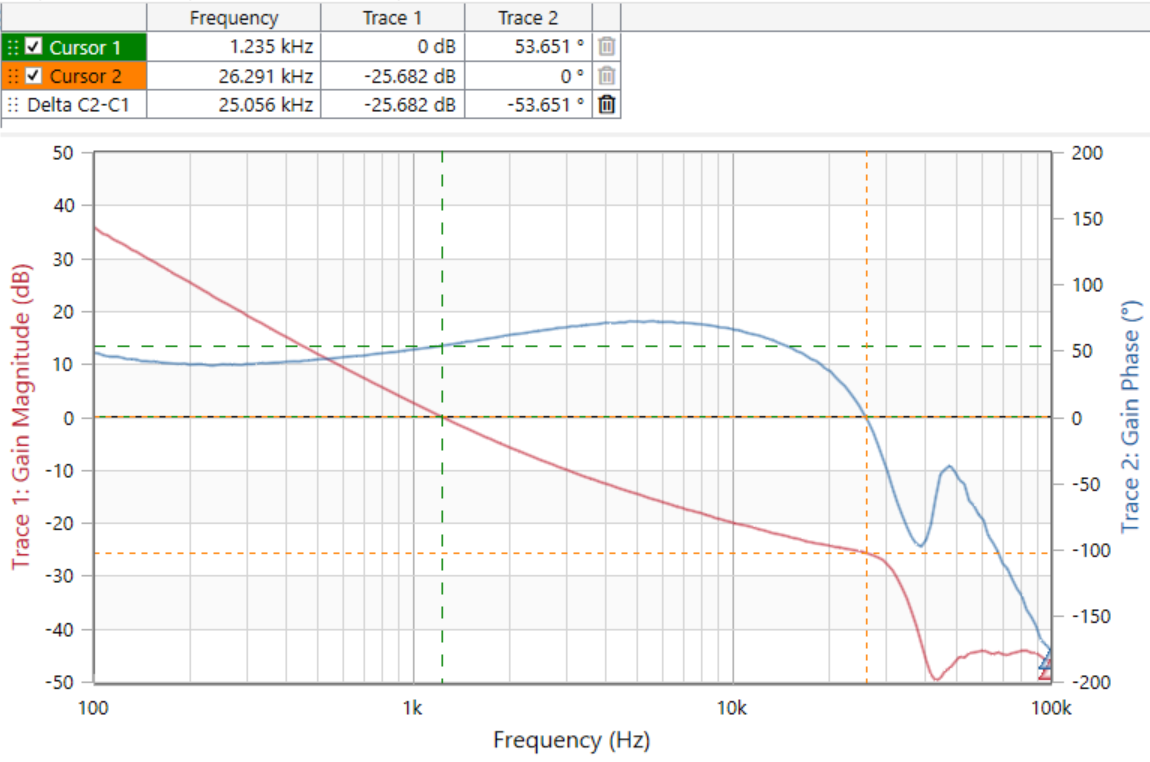
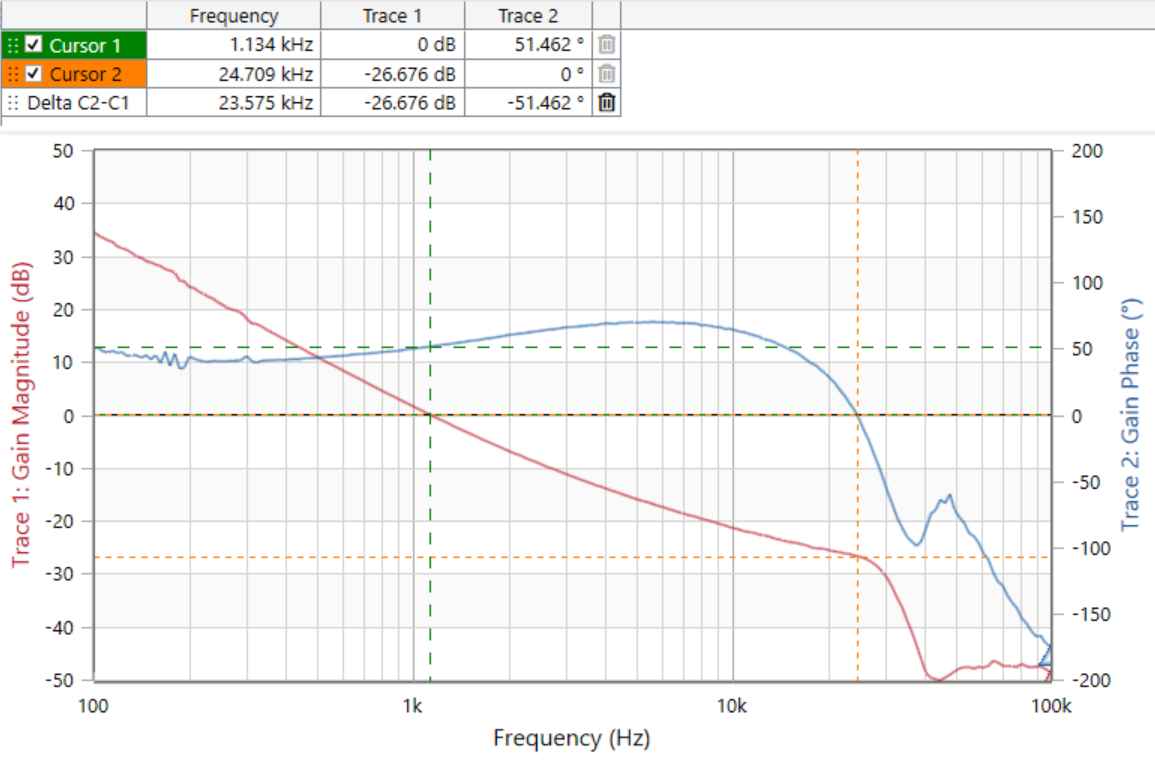
Bode plots are shown in the following figures.
 Figure 2-5 0A Load Bandwidth = 1.235kHz,
Phase Margin = 53.651Degrees, Gain Margin = 25.682dB
 Figure 2-6 3A Load Bandwidth = 1.134kHz,
Phase Margin = 51.462Degrees, Gain Margin = 26.676dB