TIDT399 July   2024


  1.   1
  2.   Description
  3.   Features
  4.   Applications
  5. 1Test Prerequisites
    1. 1.1 Voltage and Current Requirements
    2. 1.2 Required Equipment
    3. 1.3 Considerations
    4. 1.4 Dimensions
  6. 2Testing and Results
    1. 2.1 Efficiency Graphs
    2. 2.2 Thermal Images
    3. 2.3 Bode Plots
  7. 3Waveforms
    1. 3.1 Switching
    2. 3.2 Output Voltage Ripple
    3. 3.3 Load Transients
    4. 3.4 Start-Up Sequence
  8.   Trademarks

Efficiency Graphs

Figure 2-1 shows the converter efficiency for a 12V input with –7.5V and –12V outputs with the output being swept from 0.4A to 4A.
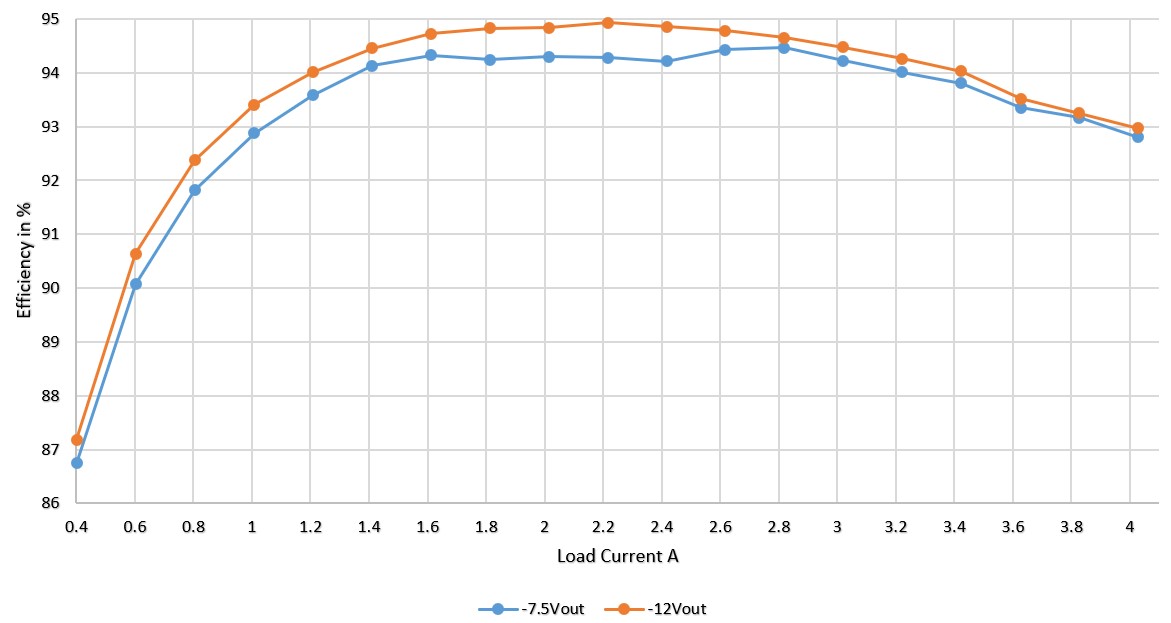
PMP23241 Converter Efficiency 12V Input, –7.5V and –12V
                        OutputsFigure 2-1 Converter Efficiency 12V Input, –7.5V and –12V Outputs