TIDT423 December   2024


  1.   1
  2.   Description
  3.   Features
  4.   Applications
  5. 1Test Prerequisites
    1. 1.1 Voltage and Current Requirements
    2. 1.2 Required Equipment
    3. 1.3 Dimensions
  6. 2Testing and Results
    1. 2.1 Efficiency Graphs
    2. 2.2 Voltage Regulation
    3. 2.3 Efficiency Data
    4. 2.4 Thermal Images
    5. 2.5 EMI
  7. 3Waveforms
    1. 3.1 Start-up and Shut Down Waveform
    2. 3.2 Switching
      1. 3.2.1 Voltage Stress
    3. 3.3 VCC Self Bias
    4. 3.4 Output Voltage Ripple
    5. 3.5 Load Dynamic Response
    6. 3.6 Peak Power
    7. 3.7 Short-Circuit Protection
    8. 3.8 Output Over Voltage Protection

Efficiency Graphs

Efficiency is shown in Figure 2-1 through Figure 2-3.
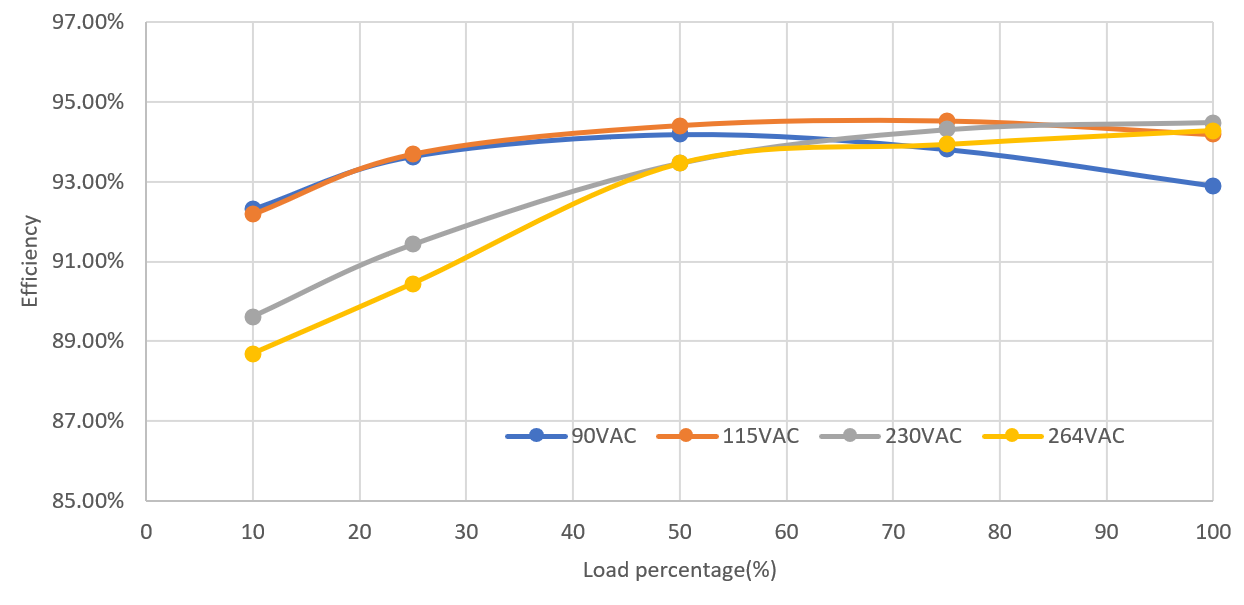
PMP41145 Efficiency Versus AC Input and LoadFigure 2-1 Efficiency Versus AC Input and Load
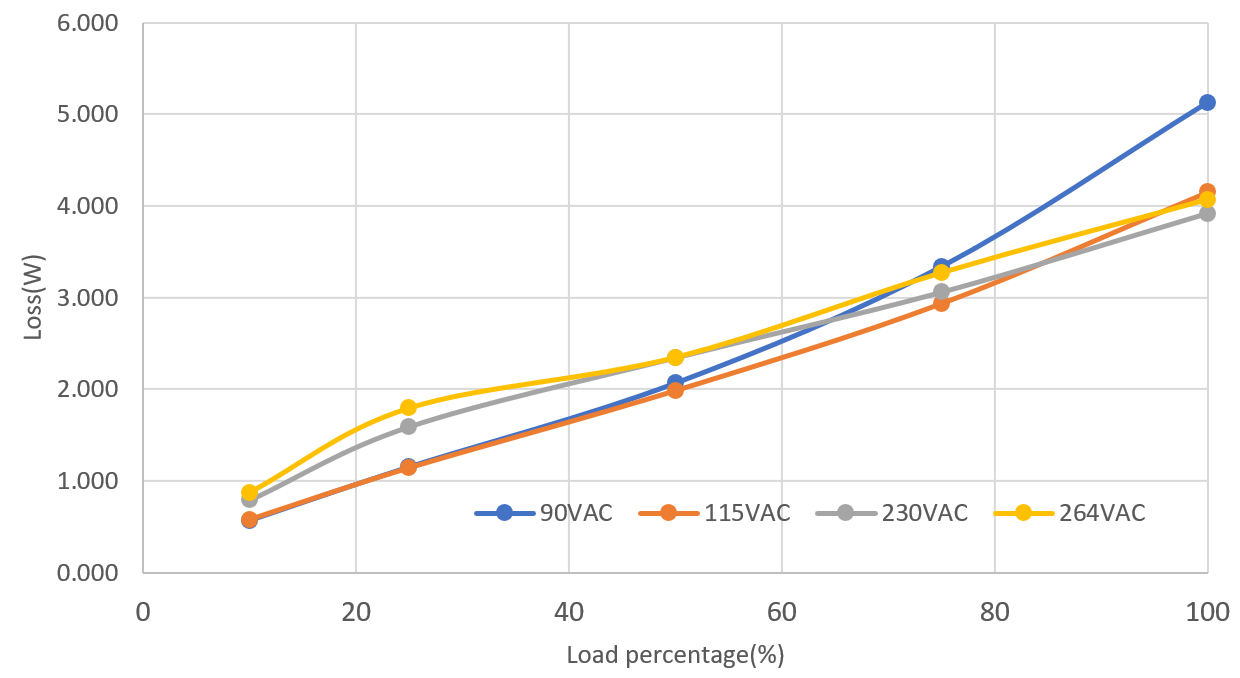
PMP41145 Power Loss Versus AC Input and LoadFigure 2-2 Power Loss Versus AC Input and Load
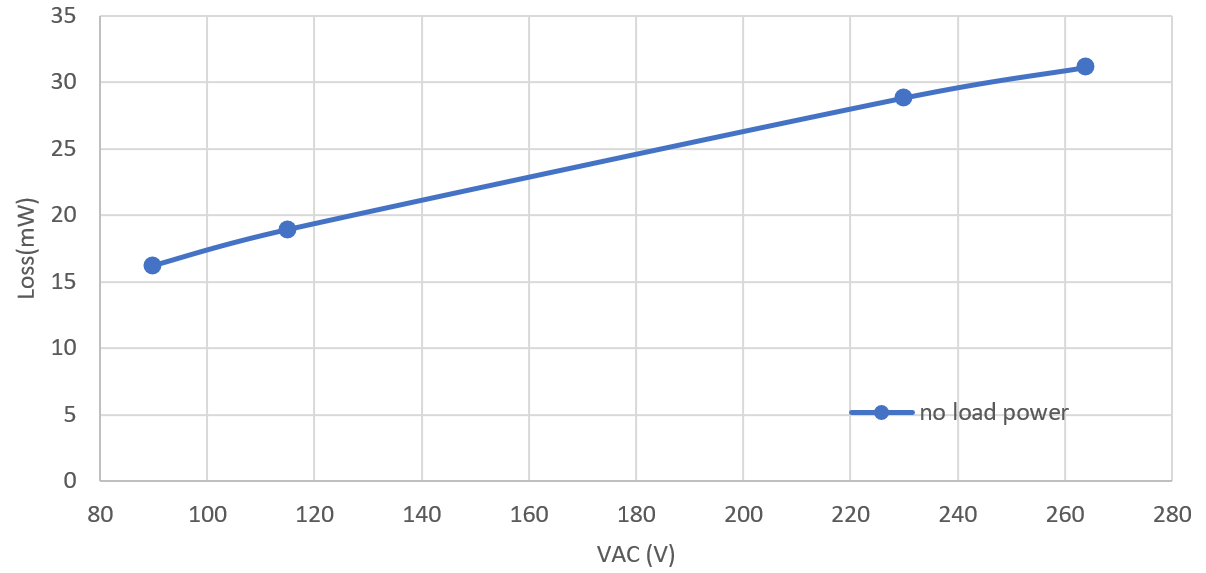
PMP41145 No Load Input Power Consumption Versus AC
                        Input VoltageFigure 2-3 No Load Input Power Consumption Versus AC Input Voltage