TIDUF97 September 2024
- 1
- Description
- Resources
- Features
- Applications
- 6
- 1System Description
- 2System Overview
- 3System Design Theory
- 4Hardware, Software, Testing Requirements, and Test Results
- 5Design and Documentation Support
- 6About the Authors
4.3.1 AMR Sensor Sin and Cos Outputs Measurement
Figure 4-4 and Figure 4-5 show the AMR sensor sine and cosine signals converted to single-ended at the input of the MSPM0G3507 ADCs over half a mechanical revolution from 0 to 180 degree mechanically. The signals are biased to 1.65V and the peak to peak amplitude is around 2V. The maximum voltage is around 2.65V, the minimum voltage is around 0.65V. The full-scale input range of the MSPM0 internal ADC is 3.3V using external REF3533 reference. That means the AMR sensors use 62% of the full-scale range giving enough headroom for signal chain gain and offset changes.
 Figure 4-4 Single-Ended AMR Sensor
Sine Waveform at the MSPM0 ADC1 Input
 Figure 4-5 Single-Ended AMR Sensor
Cosine Waveform at the MSPM0 ADC0 Input
Figure 4-5 Single-Ended AMR Sensor
Cosine Waveform at the MSPM0 ADC0 InputTo measure the signal to noise ratio and effective number of bits, 2000 consecutive of the sine and cosine signals where measured at a 32kHz sample rare and a fixed angle.
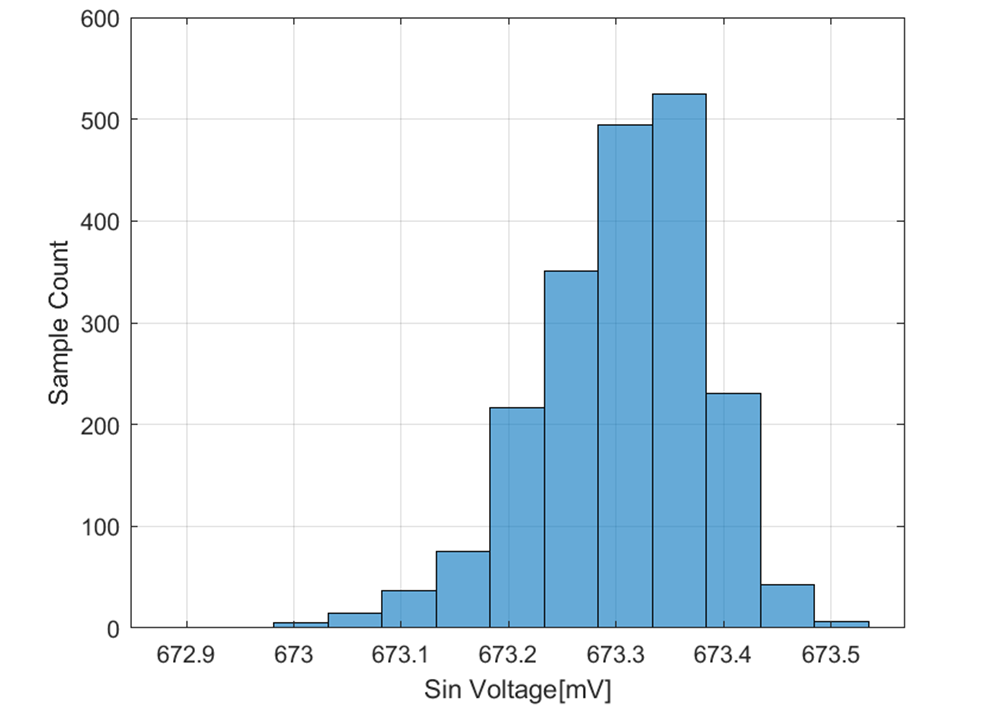
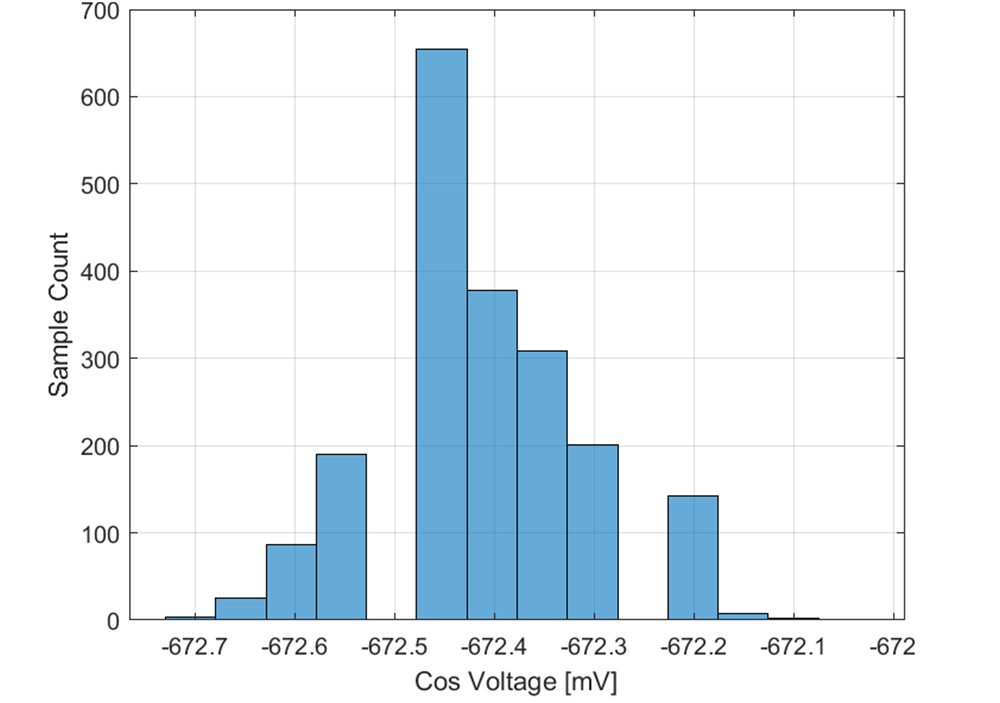
The following two figures show the offset corrected sine and cosine signals in the time domain over 62.5ms. The 1.65V bias voltage was subtracted from the corresponding A/D converted sine and cosine input signal. The peak to peak noise is within 0.6mV. Figure 4-6 and Figure 4-7 show the corresponding histogram of the sine and cosine signal.
 Figure 4-6 Sine Voltage Signal of AMR Sensor at
Mechanical Angle of 67.48 deg With Bias Voltage Correction
 Figure 4-7 Cosine Voltage Signal of AMR Sensor at
Mechanical Angle of 67.48 deg With Bias Voltage Correction
 Figure 4-8 Histogram Sin Signal, 2000 Samples
 Figure 4-9 Histogram Cos Signal, 2000 Samples
The standard deviation, signal-to-noise ratio (SNR) and effective number of bits (ENOB) versus full-scale range are shown in Table 4-4. With the ADC in 64-times averaging mode the SIN signal’s ENOB is 13.3 bit, the COS is 13 bit.
| Parameter | X-axis | Y-axis | Comment |
|---|---|---|---|
| Standard deviation [mV] | 0.082 | 0.101 | RMS |
| Sin/Cos amplitude [V] | 1 | 1 | peak |
| SNR [dB] | 81.7 | 80 | dB |
| ENOB [bit] | 13.3 | 13 | Bit |