DLPU066A March 2018 – April 2022
6.3 Temperature Characterization
- Setup the reference system in the temperature chamber. The reference system will be used to gather temperature trend information that can then be applied to all systems during the calibration process. Data will be gathered from the reference system at multiple temperatures.
- Select "Iterative Calibration" >> "Temperature Compensation Trends" >> "Sweeps" from the menu on the left.
- In the sweep settings menu select your light meter from drop down menu.
- Enter calibration temperature as the current temperature of the chamber. This should eventually be done for a cold temperature (–40°C), room temperature (25°C) ,and the max system temperature (105°C). At a minimum, two temperature sweeps are required in order to generate a calibration file, but typically several temperatures are calibrated for.
- At a minimum room temperature and one other temperature are required in order to generate a calibration file.
- Adjust minimum and maximum PWM values, increment values, number of averaged measurements, and measurement delay. The default values for all of these parameters are typically acceptable. Measurement delay must be at least 50 ms.
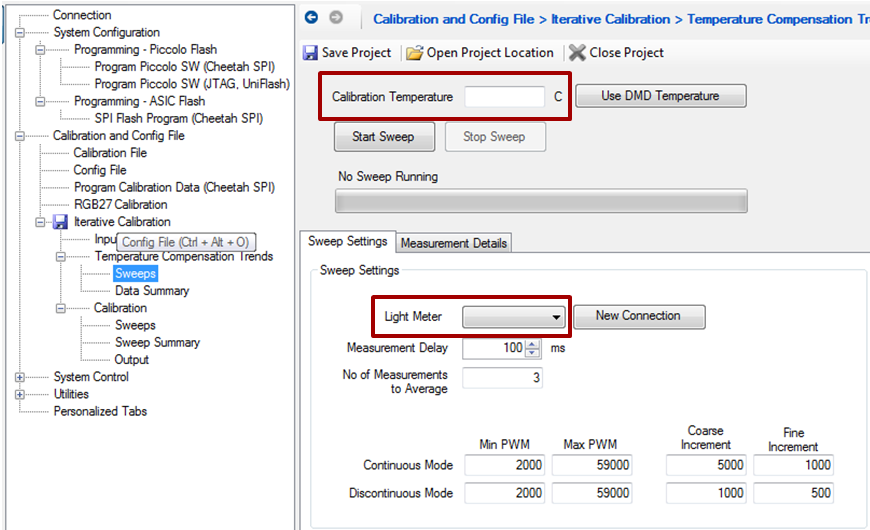 Figure 6-5 Iterative Calibration: Temperature Compensation Sweeps
 - Press "Start Sweep."
- The Automotive Control Program will step through each coarse combination, sweep through the LED PWM ranges, and determine the minimum and maximum brightness for each LED (RGB). The program will prompt the user when it is appropriate to switch between ND filters.
- Individual measurement details will be recorded for debugging purposes. This can be viewed in the "Measurement Details" tab and in the 'Log' folder in the Calibration project directory.
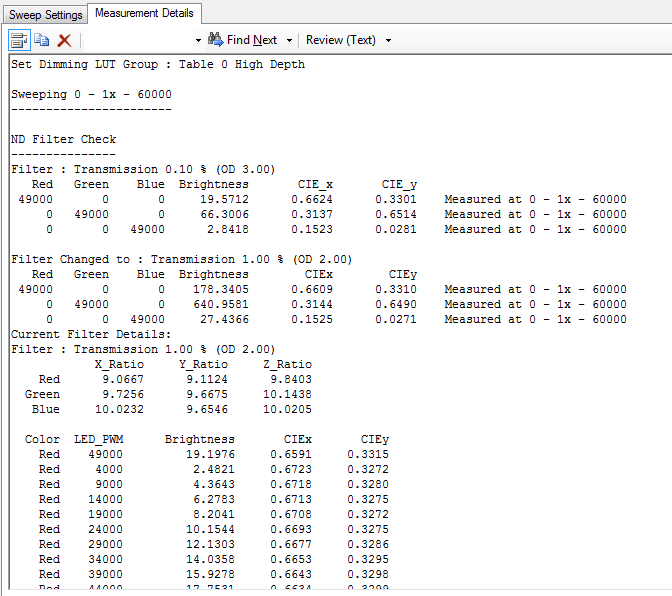 Figure 6-6 Iterative Calibration: Measurement Details
 - Adjust the temperature of the system and repeat the temperature sweep procedure.
- Data from the temperature sweeps can be viewed in the "Data Summary" menu on the left.
- The "Sweep Characteristics" tab shows a visual representation of the recorded data. Brightness and color point information can be viewed for each LED at each temperature.
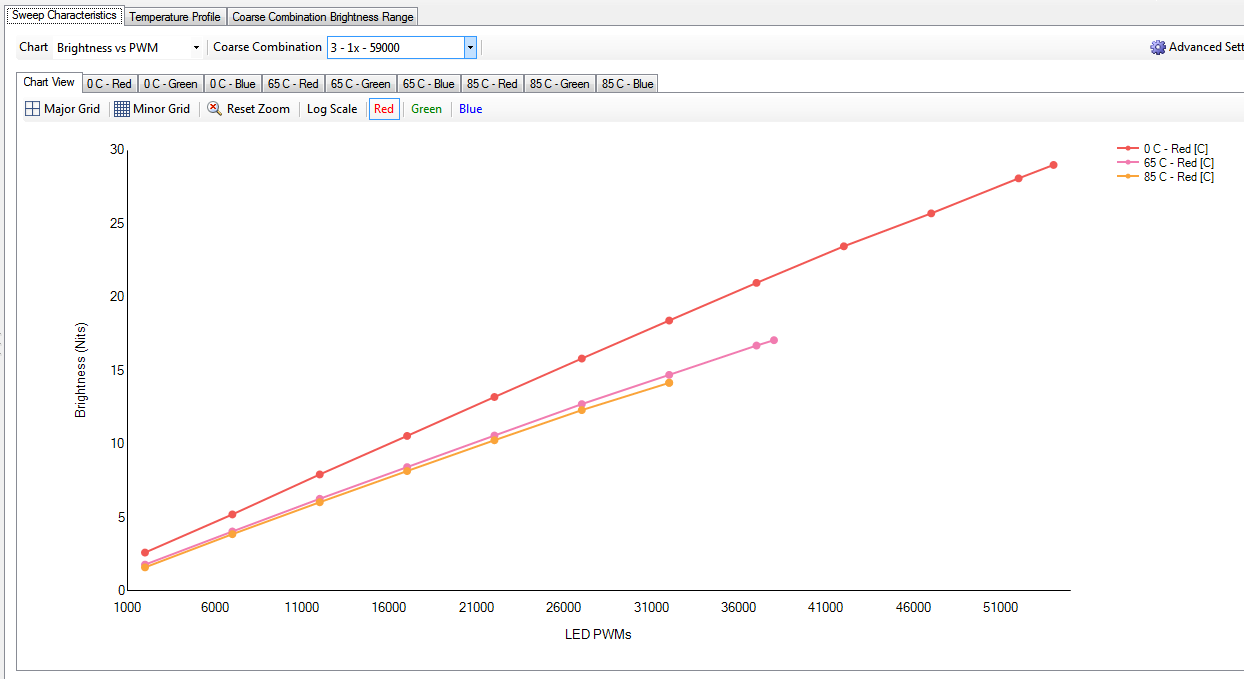 Figure 6-7 Brightness Output vs LED PWM Value
 - The "Temperature Profile" tab displays the maximum brightness achievable at a given color point and temperature in graph form. Figure 6-8 shows an example.
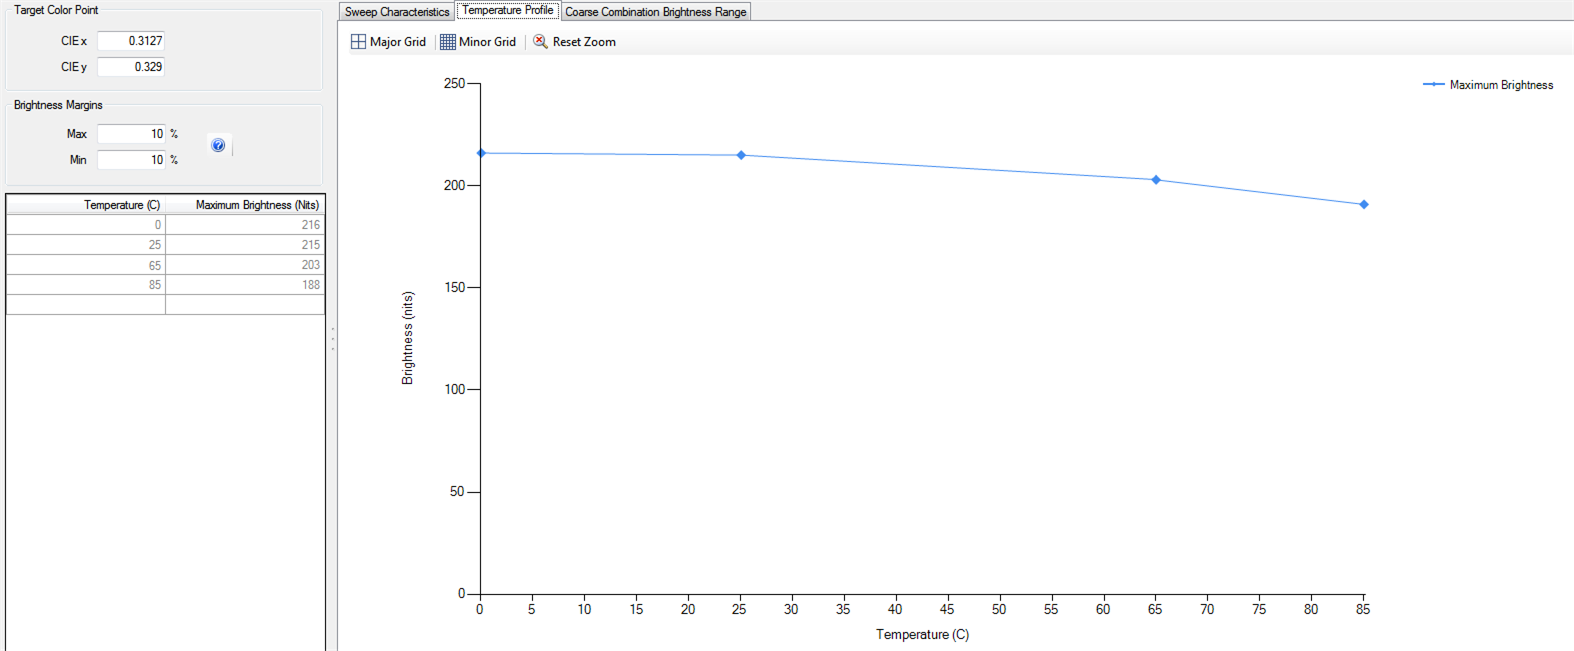 Figure 6-8 Brightness Output vs Temperature
 - The "Coarse Combination Brightness Range" tab displays the maximum brightness achievable for a given coarse combination. Data can be viewed per temperature or transition region.
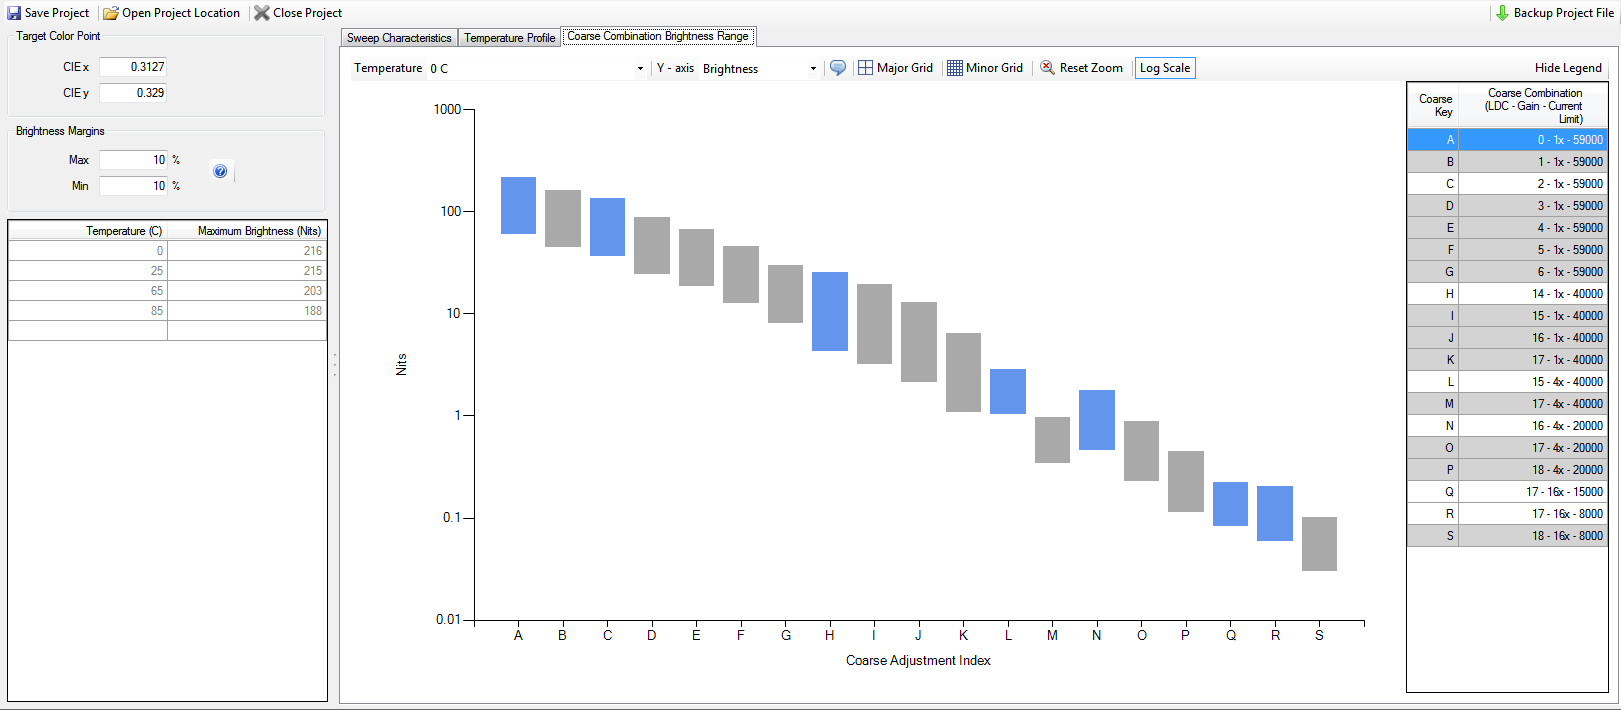 Figure 6-9 Brightness Output vs Coarse Combination
 - When reviewing the ranges there are options for adjusting the view including temperature, brightness or backlight, zooming into particular regions, adding notifications regarding discontinuities, and scale (log vs standard).
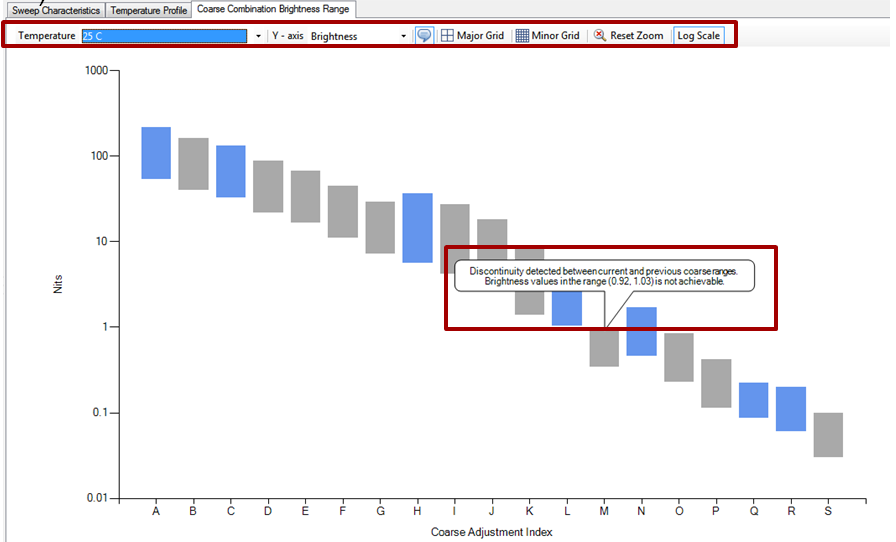 Figure 6-10 Brightness Discontinuities
 - If discontinuities do exist at any brightness ranges, return to Section 6.2 and adjust the coarse combinations as described in Section 5, then rerun the temperature sweeps.