SBAA510 October   2021 DRV5032 , TMAG5170 , TMAG5231 , TMAG5273


  1.   Trademarks
  2. 1Introduction
  3. 2Reed Switch Overview
  4. 3Hall Effect Sensor Overview
  5. 4Performance Comparison
  6. 5DRV5032 Test Setup and Results
    1. 5.1 DRV5032 Test Setup
    2. 5.2 Understanding the Results
    3. 5.3 DRV5032 Test Results
    4. 5.4 Front Approach Results
    5. 5.5 Side Approach
    6. 5.6 Tamper Susceptibility Testing Setup
    7. 5.7 Tamper Susceptibility Test Results
  7. 6Reed Switch Test Setup and Results
    1. 6.1 Reed Switch Test Setup
    2. 6.2 Reed Switch Test Results
    3. 6.3 Front Approach Results
    4. 6.4 Side Approach Results
    5. 6.5 Tamper Susceptibility Testing Setup
    6. 6.6 Reed Switch Tamper Susceptibility Test Results
  8. 7TMAG5170 Test Setup and Results
    1. 7.1 TMAG5170 Test Setup
    2. 7.2 TMAG5170 Test Results
    3. 7.3 TMAG5170 Tamper Susceptibility Testing Setup
    4. 7.4 TMAG5170 Tamper Susceptibility Test Results
  9. 8Summary

Understanding the Results

Because of the nodal testing, along with the observed detection distance on the variable axis for each specific node, a table format was used like the one shown in Figure 5-3. The sensor height remains constant throughout all testing while the change in the Y (or X in the case of the side approach) remains constant for 6 iterations of height (Z) values. The off-plane height is simply the magnets Z position minus the sensor height. Lastly, the X value in the last column is the observable detection point distance as measured during testing for each particular node.
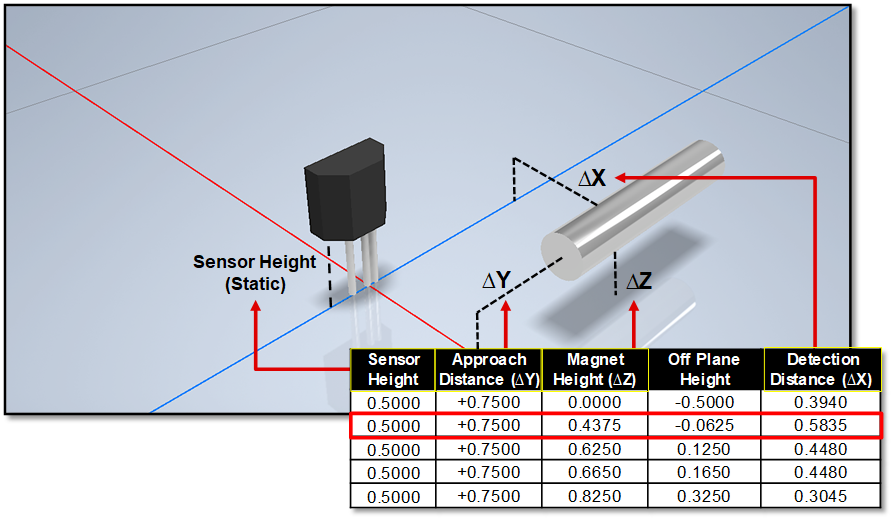
GUID-20210810-SS0I-G2KW-VTMC-HWFZZJXCDLBG-low.pngFigure 5-3 Understanding the Test Results