SBAA600 October 2024 TAA5212 , TAC5111 , TAC5112 , TAC5211 , TAC5212
3 VAD Performance Results
This section discusses the VAD performance. The algorithm performance is given by a Receiver Operating Characteristic (ROC) curve which describes the detection performance across different operating thresholds (–12dB to –3dB). ROC plots are included for the noise scenarios from the Aurora Noise database (Figure 3-1 Car , Figure 3-2 restaurant and Figure 3-3 Train) and speech signals from the NOIZEUS Speech database. Test vectors are generated by mixing noise and speech signals at the desired SNR (SNR is the separation between the power levels of speech and noise signals) of 12, 18, and 24dB (for example, 12dB SNR means noise power level is 12dB down from the speech power level). These SNR values were chosen based on common output values of microphones. This data was also taken with an 8kHz sampling rate for the best expected performance.
The ROC plots start with a -12dB threshold at the extreme top left and moves towards the right as the threshold is increased. Speech Hitrate is the accuracy of the VAD to correctly detect voice when the VAD is present in the input signal. Non-Speech Hitrate is the accuracy of the VAD to correctly ignore dynamic movements in the noise signal. A high hit rate for both speech and non-speech indicates the algorithm's ability to correctly detect voice when present and prevent false positives when voice is not present.
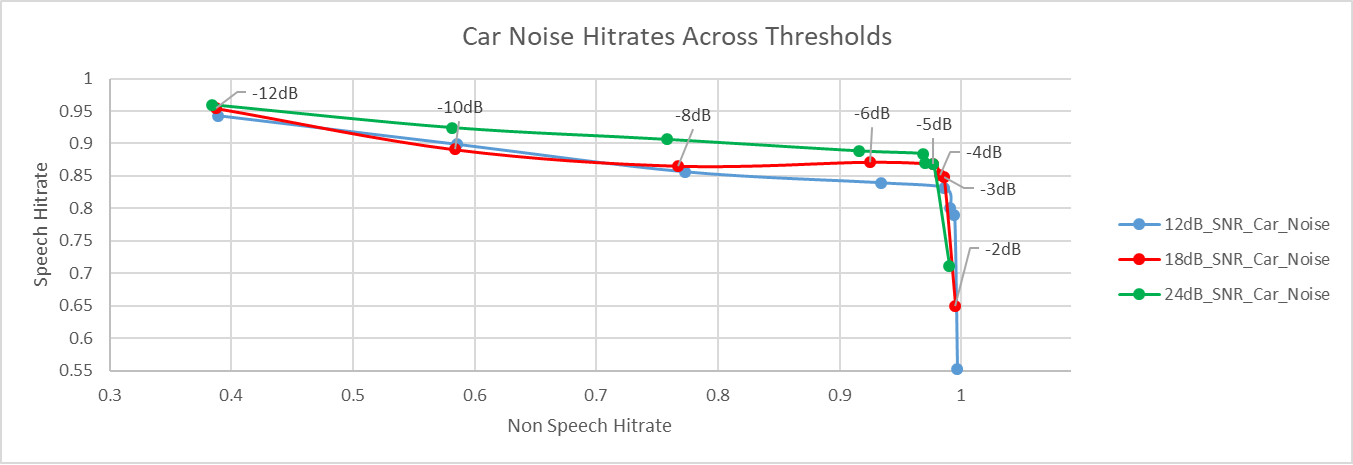 Figure 3-1 Non-Speech Hit Rate vs Speech
Hit Rate for Car Noise
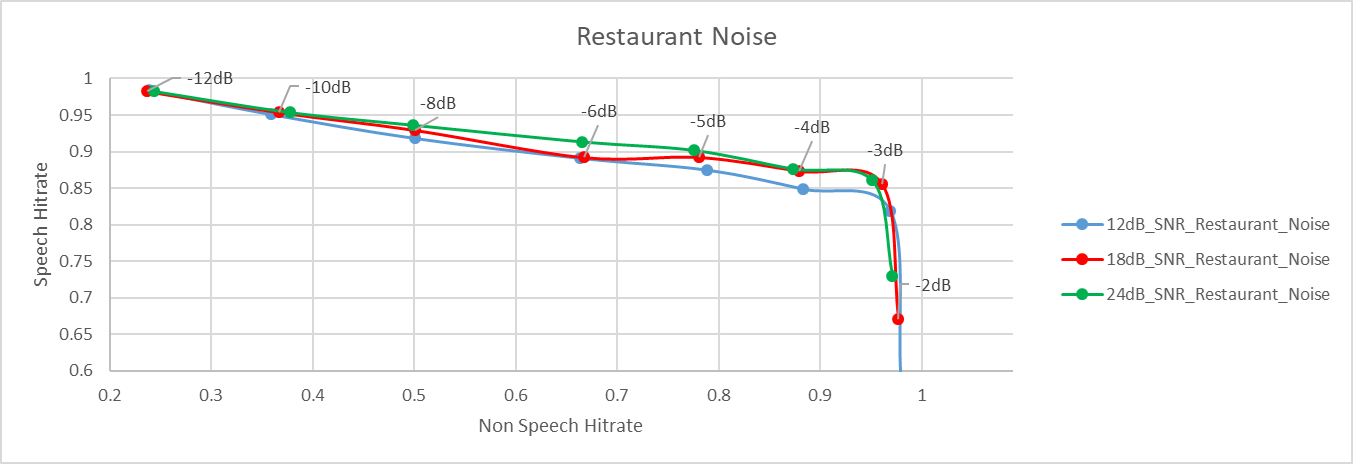 Figure 3-2 Non-Speech Hit Rate vs Speech
Hit Rate for Restaurant Noise
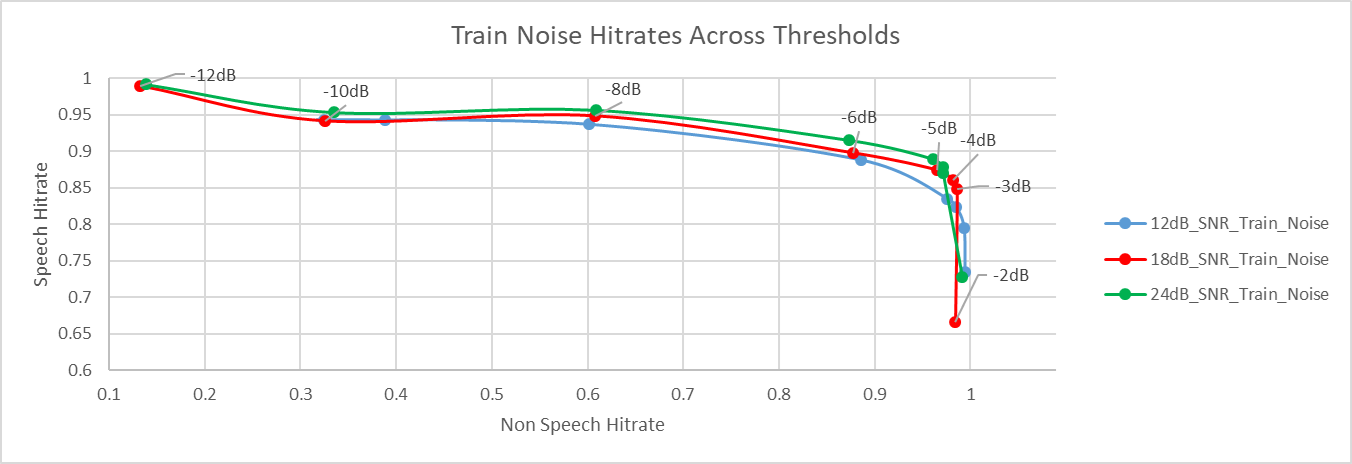 Figure 3-3 Non-Speech Hit Rate vs Speech
Hit Rate for Train Noise
Figure 3-3 Non-Speech Hit Rate vs Speech
Hit Rate for Train NoiseAfter analyzing the collected data, the –5dB threshold was chosen to give the best speech hit rate and non-speech hit rate across different noise types. ROC curve at –5dB threshold for different noise types is as shown for 6, 12, 18, and 24dB SNR.
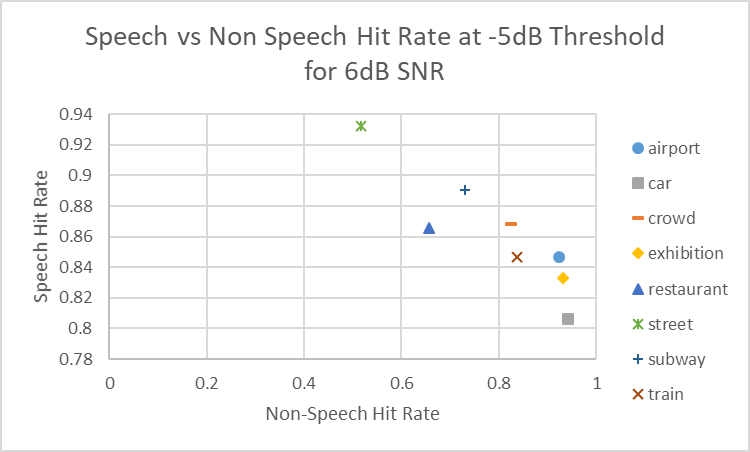 Figure 3-4 Non-Speech Hit Rate vs
Speech Hit Rate at -5dB Threshold for 6dB SNR
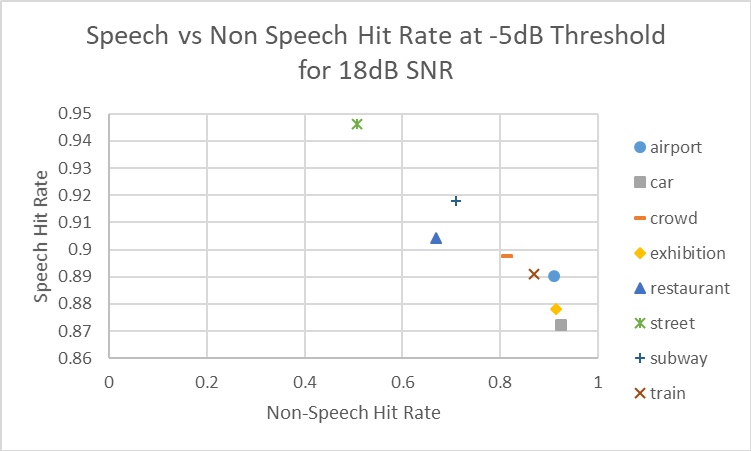 Figure 3-6 Non-Speech Hit Rate vs
Speech Hit Rate at –5dB Threshold for 18dB SNR
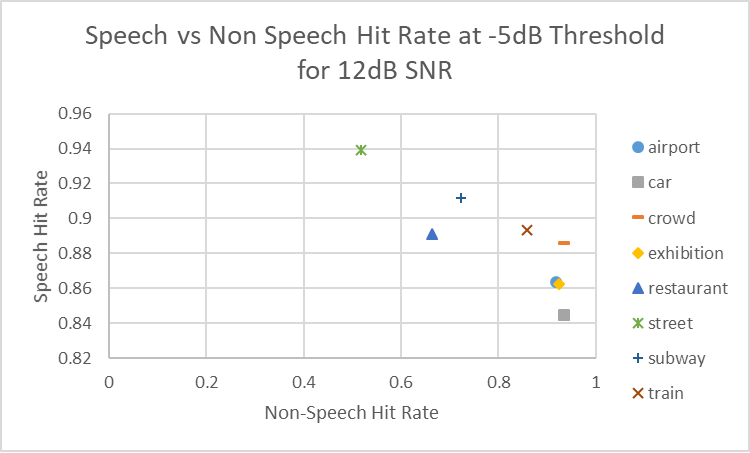 Figure 3-5 Non-Speech Hit Rate vs
Speech Hit Rate at –5dB Threshold for 12dB SNR
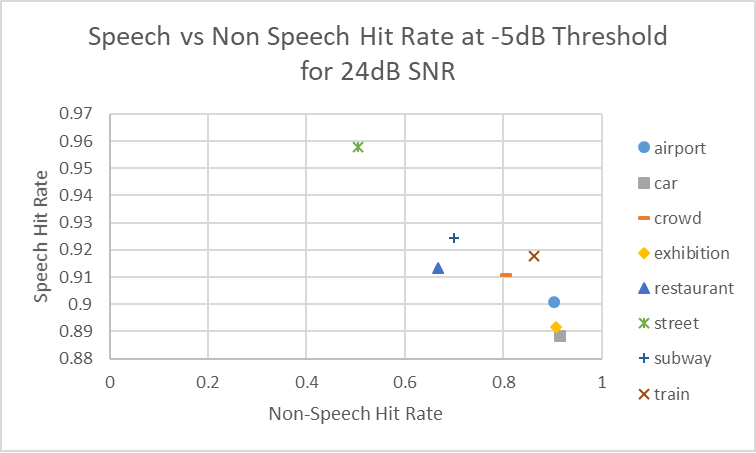 Figure 3-7 Non-Speech Hit Rate vs
Speech Hit Rate at –5dB Threshold for 24dB SNR