SBAA660 October 2024 AFE7728D , AFE7768D , AFE7769D
Introduction
This application brief presents digital predistortion (DPD) results of the AFE77xxD transceiver in conjunction with the GTRB267008FC power amplifier (PA). First, a high-level overview of the test setup and transceiver configuration for DPD is explained, followed by adjacent channel leakage ratio (ACLR) test results for three distinct use cases.
The AFE77xxD is a high-performance, multichannel transceiver, integrating that includes integration of:
- Four direct up-conversion transmitter chains
- Four direct down-conversion receiver chains
- Two wideband RF-sampling digitizing auxiliary chains (feedback paths)
- Low-power digital predistortion (DPD) engine for PA linearization
The GTRB267008FC PA is a Gallium Nitride (GaN) device with broad applications in wireless infrastructure, communications equipment, and Macro cells.
Test Conditions and Setup
 Figure 1 Block Diagram of Test
Setup
Figure 1 Block Diagram of Test
SetupThe measurements published in this report are from a single PA using TI’s test setup shown in Figure 1. There is a potential for slight DPD linearization differences due to part-to-part variations. PA vendors release other versions of the same EVM with enhanced efficiency and linearity performance. Depending on the DPD line up, customers use different components to further fit into end application usage. Evaluate component selection to establish reproducible results highlighted in this DPD report.
| Parameter | Detail |
|---|---|
| Gain of pre-driver amplifier and gain block | 61dB |
| Instantaneous bandwidths (IBW) tested | 20MHz, 100MHz, 160MHz |
| Key Attribute | Value(1) |
|---|---|
| Power amplifier | GTRB267008FC |
| Operating frequency range | 2496MHz – 2690MHz |
| Rated output power | 49.3dBm |
| PA type | GaN |
| Gain | 14.7dB |
| Efficiency | 53% |
| Supply voltage | 48VDS |
 Figure 2 Example Graphical User
Interface (GUI) for AFE77xxD DPD
Figure 2 Example Graphical User
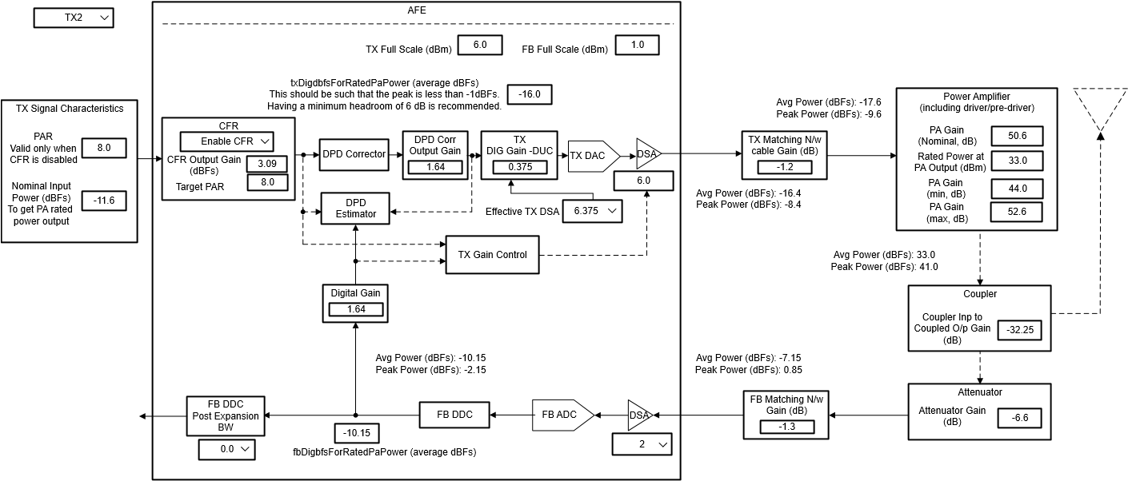
Interface (GUI) for AFE77xxD DPDThe AFE77xxD device is configured through TI's Latte software which facilitates system integration of the AFE into the system or end equipment for a customized setup of the transceiver. Customers have moderate control of AFE configuration, depending on a given use case based on multiple parameters such as PA type, frequency range, PA gain, and bandwidth. The flexible adjustment of such parameters is performed without changing the system hardware, which further simplifies the system integration process.
5G New Radio (NR) is the standard signal in wireless communications and is the signal used for the following tests in this report.
Test Case 1
| Parameter(1) | Value |
|---|---|
| TX interface rate | 61.44MSPS |
| DPD rate | 122.88MSPS |
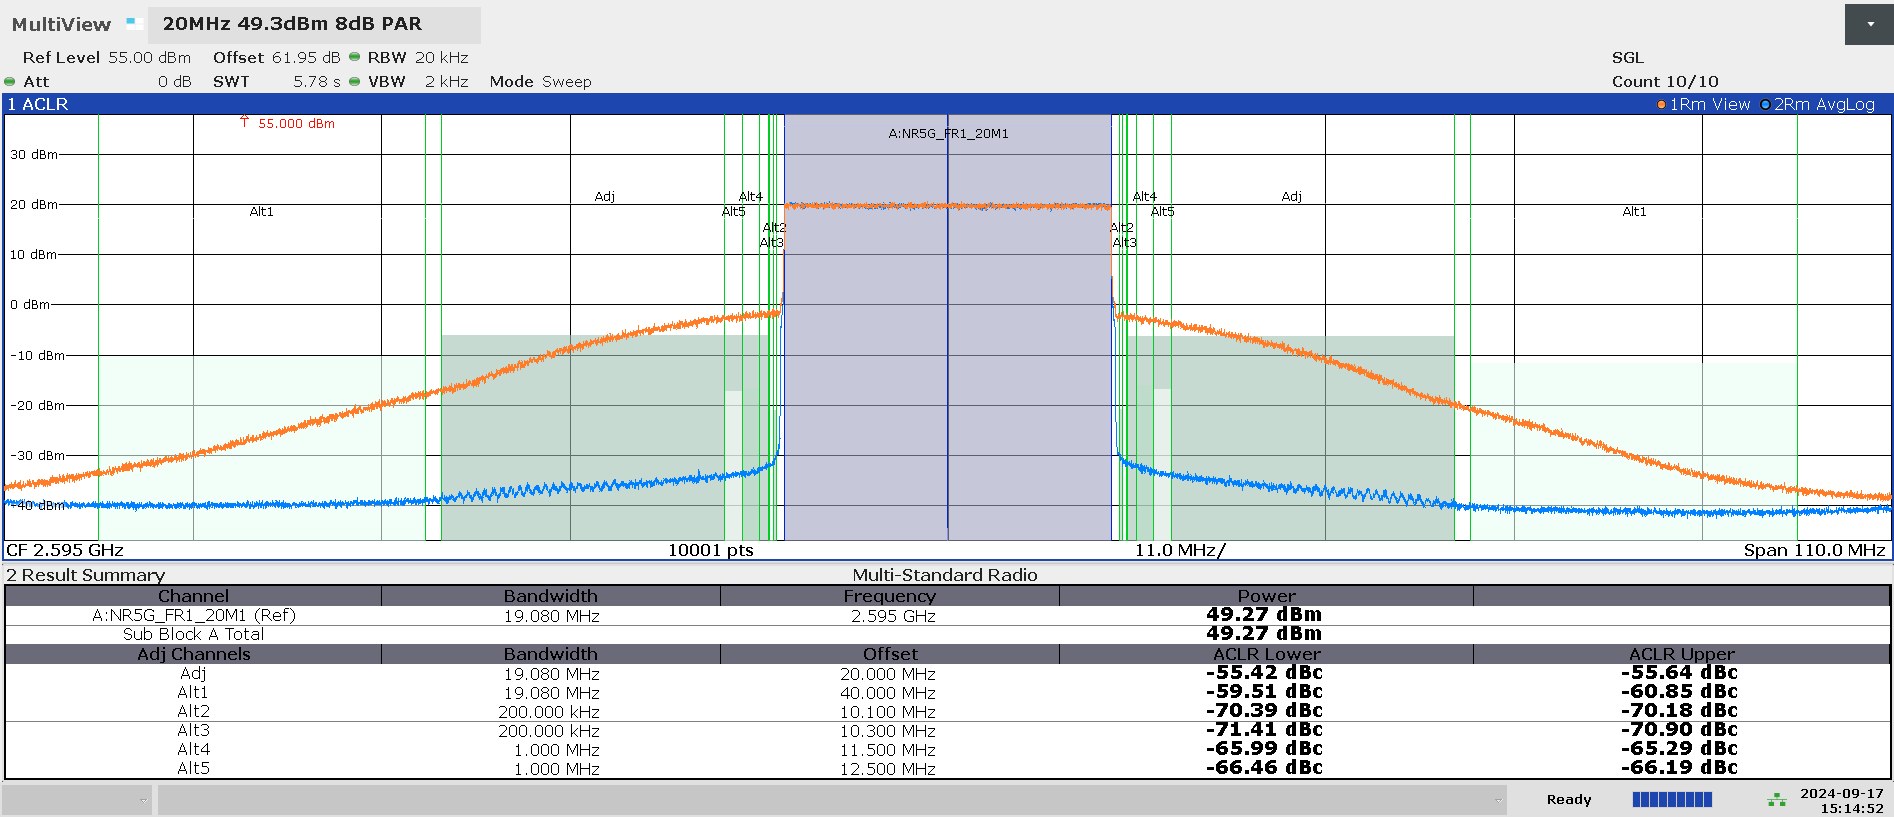
 Figure 3 Case 1: ACLR Plot Before
(Orange) and After (Blue) DPD Is Enabled
Figure 3 Case 1: ACLR Plot Before
(Orange) and After (Blue) DPD Is Enabled| Parameter | PA Output Power | Adjacent Power Lower | Adjacent Power Upper | Alternate Power Lower | Alternate Power Upper | PA Efficiency |
|---|---|---|---|---|---|---|
| Without DPD | 49.3dBm | –25.7dBc | –27dBc | –43.4dBc | –46.8dBc | N/A |
| With DPD | 49.3dBm | –55.4dBc | –55.6dBc | –59.5dBc | –60.8dBc | 52.8% |
Test Case 2
| Parameter(1) | Value |
|---|---|
| TX interface rate | 122.88MSPS |
| DPD rate | 368.64MSPS |
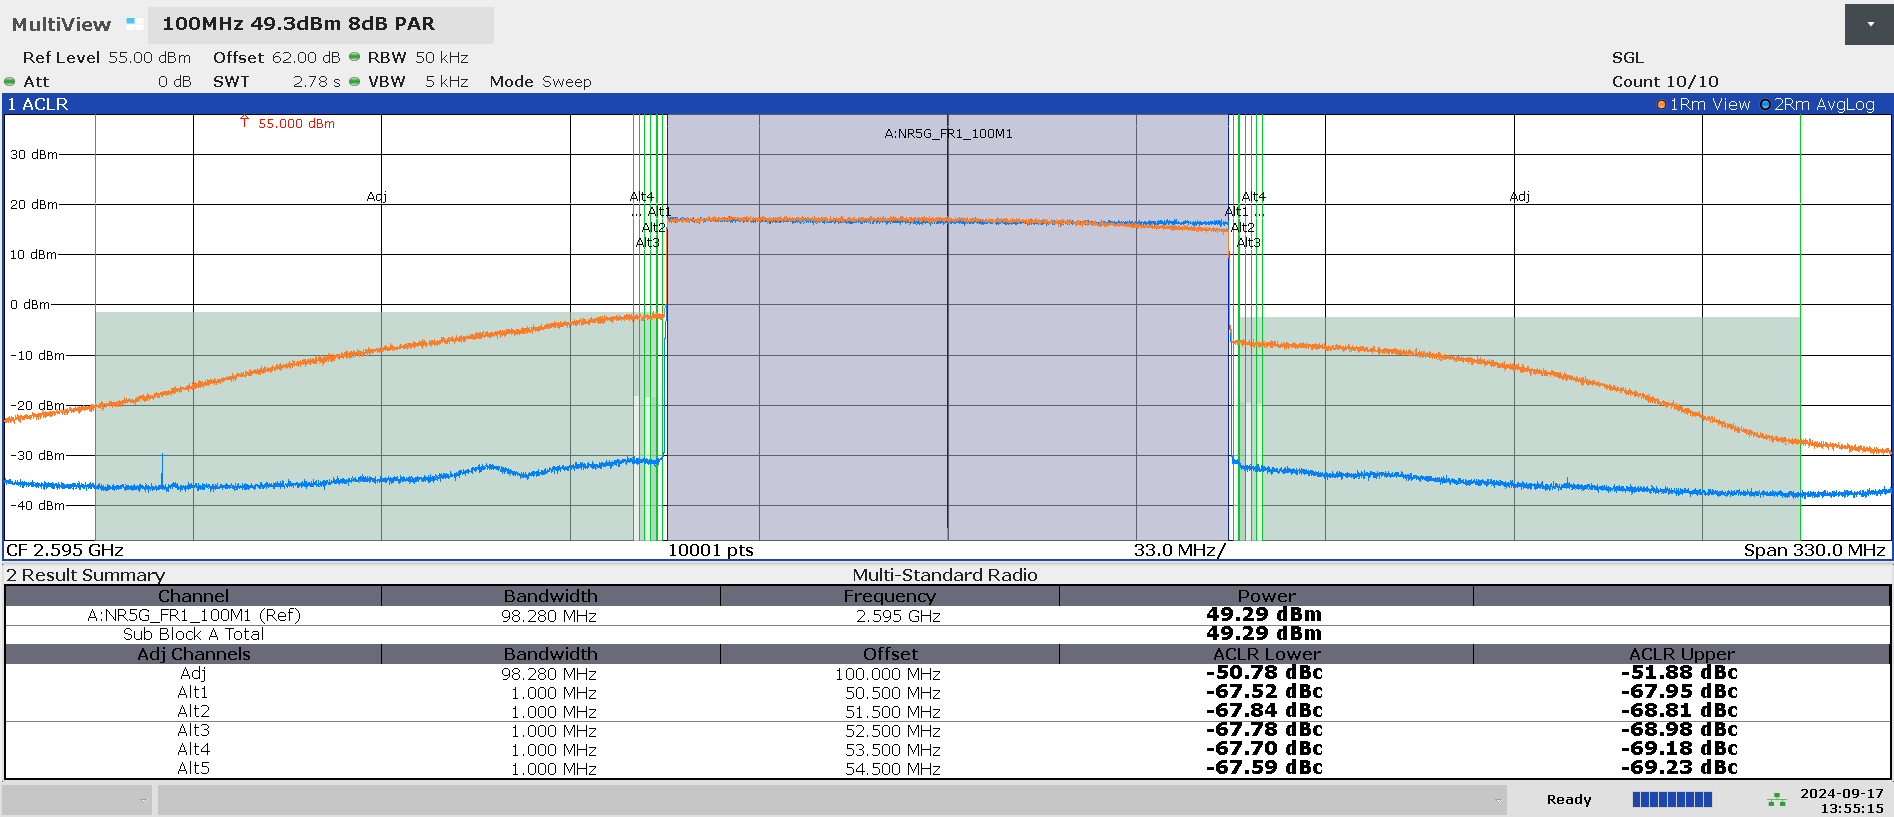
 Figure 4 Case 2: ACLR Plot Before
(Orange) and After (Blue) DPD Is Enabled
Figure 4 Case 2: ACLR Plot Before
(Orange) and After (Blue) DPD Is Enabled| Parameter | PA Output Power | Adjacent Power Lower | Adjacent Power Upper | PA Efficiency |
|---|---|---|---|---|
| Without DPD | 49.3dBm | –23.9dBc | –28.8dBc | N/A |
| With DPD | 49.3dBm | –50.8dBc | –51.9dBc | 53% |
Test Case 3
| Parameter(1) | Value |
|---|---|
| TX interface rate | 245.76MSPS |
| DPD rate | 737.28MSPS |
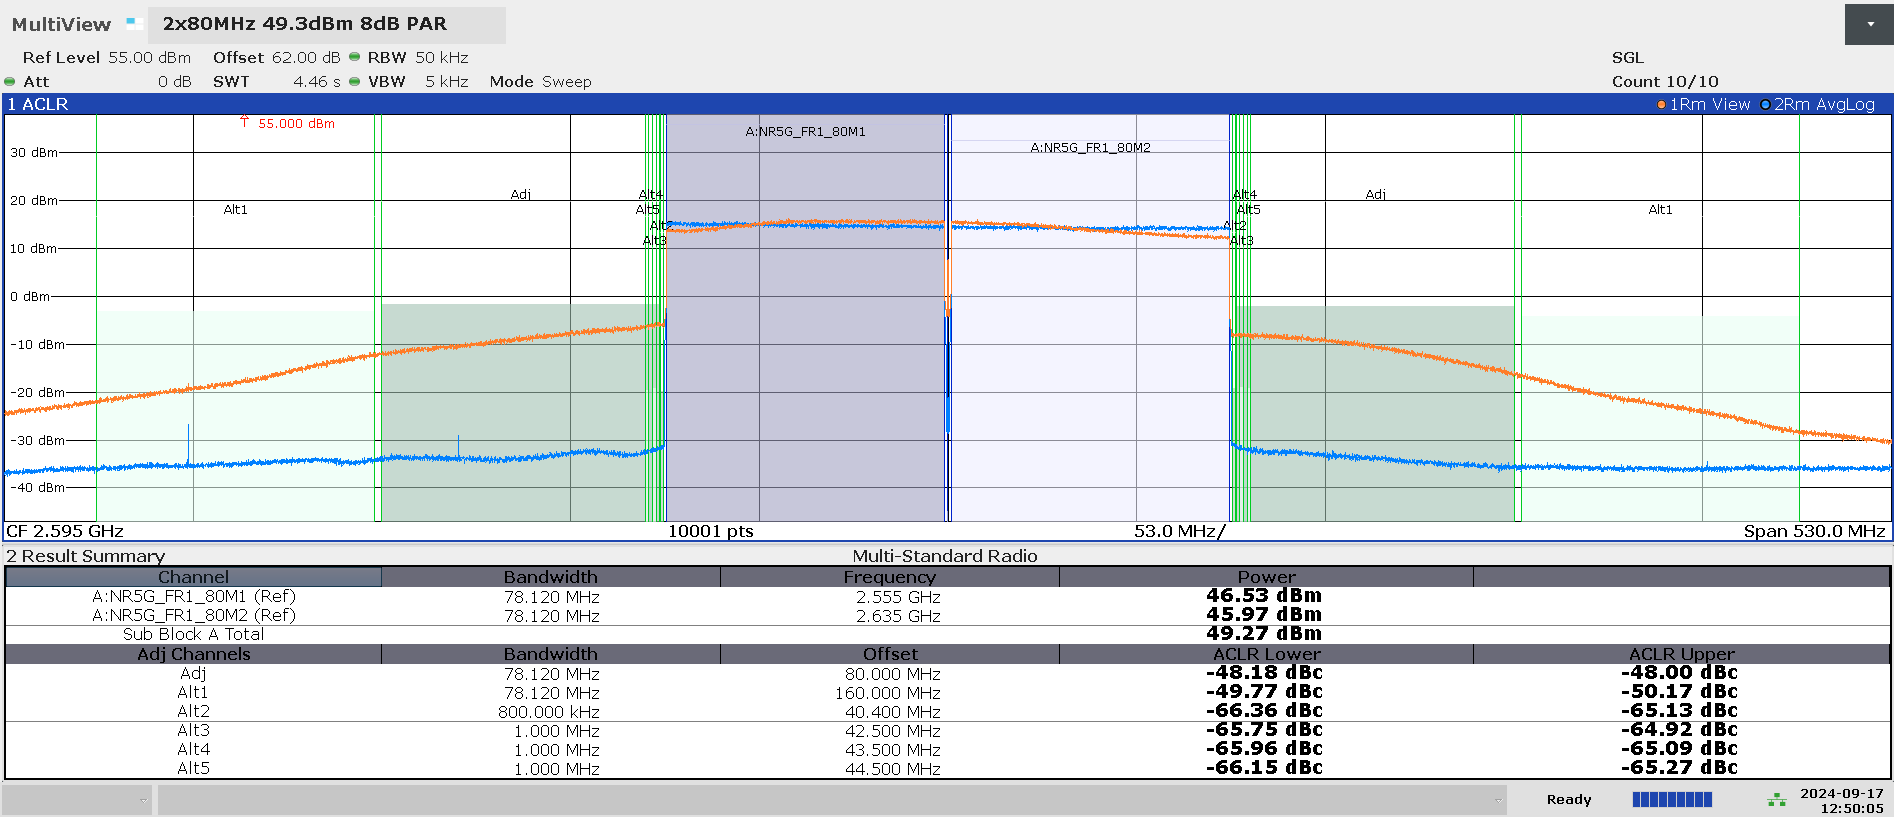
 Figure 5 Case 3: ACLR Plot Before
(Orange) and After (Blue) DPD Is Enabled
Figure 5 Case 3: ACLR Plot Before
(Orange) and After (Blue) DPD Is Enabled| Parameter | PA Output Power | Adjacent Power Lower | Adjacent Power Upper | Alternate Power Lower | Alternate Power Upper | PA Efficiency |
|---|---|---|---|---|---|---|
| Without DPD | 49.3dBm | –23.8dBc | –24.5dBc | –31.7dBc | –35.5dBc | N/A |
| With DPD | 49.3dBm | –48.2dBc | –48dBc | –49.8dBc | –50.2dBc | 53% |
Summary
The content in Table 9 summarizes test conditions and Table 10 summarizes case results.
| Test | Center Frequency | Signal Bandwidth | Power | PAR | VDS |
|---|---|---|---|---|---|
| Case 1 | 2595MHz | 20MHz | 49.3dBm | 8dB | 48V |
| Case 2 | 2595MHz | 100MHz | 49.3dBm | 8dB | 48V |
| Case 3 | 2595MHz | 2×80MHz | 49.3dBm | 8dB | 48V |
| Test | PA Output Power | Adjacent Power Lower | Adjacent Power Upper | Alternate Power Lower | Alternate Power Upper | PA Efficiency |
|---|---|---|---|---|---|---|
| Case 1 | 49.3dBm | –55.4dBc | –55.6dBc | –59.5dBc | –60.8dBc | 52.8% |
| Case 2 | 49.3dBm | –50.8dBc | –51.9dBc | N/A | N/A | 53% |
| Case 3 | 49.3dBm | –48.2dBc | –48dBc | –49.8dBc | –50.2dBc | 53% |
In conclusion, the AFE77xxD demonstrates linearization capability on the GTRB267008FC PA through unique DPD algorithms, and at the same time reduces power consumption when compared to TX line-up designs without DPD capability.