SBAU439 January 2024
3.1.6 Using the Histogram Tab
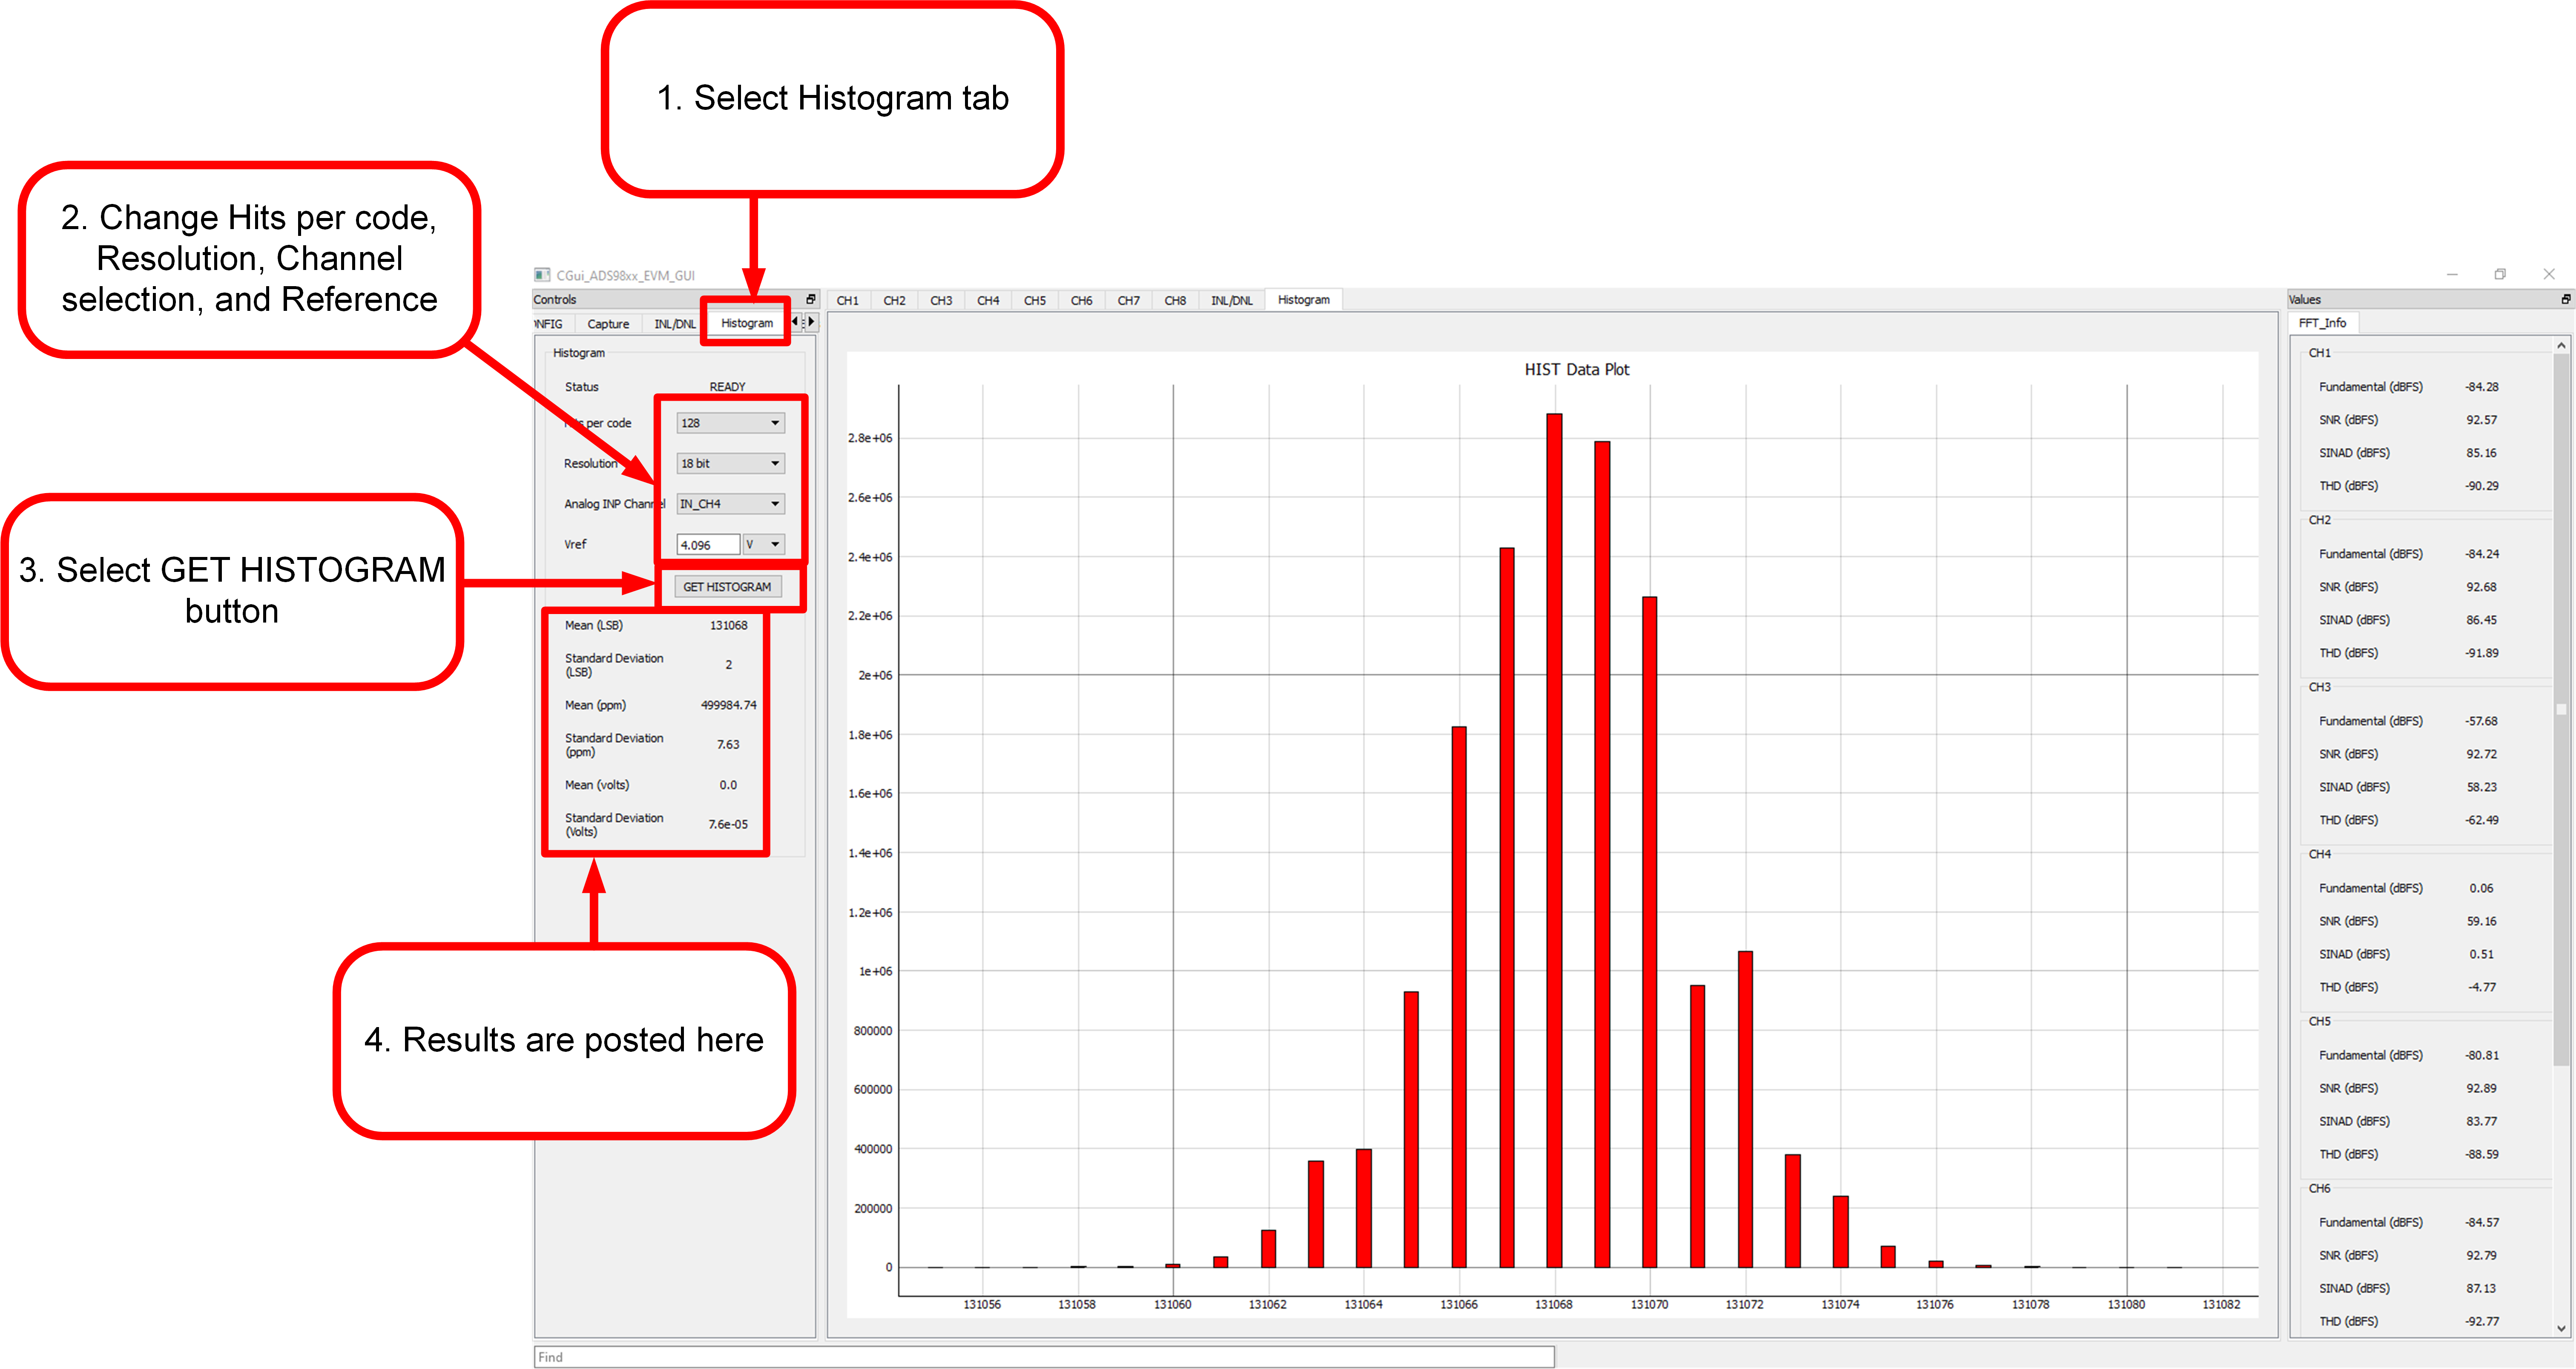
The Histogram tool represents the distribution of ADC output codes for a given sample set. The accuracy of the statistical summary can be improved by increasing hits per code, which increases the sample size at the cost of extra test time. Select the channel to measure and configure the hits per code, channel, resolution, and enter the reference voltage value. Then, press the GET HISTOGRAM button as shown in Figure 4-8.
The cumulative effect of noise coupling to the ADC output comes from sources such as the input drive circuits, the reference drive circuit, the ADC power supply, and the ADC. The total noise is reflected in the standard deviation of the ADC output code histogram that is obtained by performing multiple conversions of a DC input applied to a given channel. Selecting the correct reference voltage gives the result in units of voltage instead of codes.
Note that any data collected the histogram tab is not saved or stored on the Capture Tab. As a result, switching between the tabs results in lost data. Saving data on this screen does not provide the raw ADC codes but instead saves the histogram data presented on this tab in codes per bin. To save the raw ADC output values, use the Capture tab.
 Figure 3-8 Using the Histogram Tab