SBOA594 August 2024 OPA2990
- 1
- Abstract
- Trademarks
- 1 Introduction
- 2 Circuit Description
- 3 Supporting Multiple Output Ranges
- 4 Resistor Sizing, M2 Selection, and Other Design Considerations
- 5 Mode and Range Control
- 6 Supply Level for Current Output
- 7 Supply Levels for Voltage Output
- 8 Protection Features
- 9 Measurement Results
- 10Power Consumption
- 11Error Monte-Carlo Analysis
- 12Rise and Fall Times
- 13Building Multi-Channel Output
- 14Summary
- 15References
11 Error Monte-Carlo Analysis
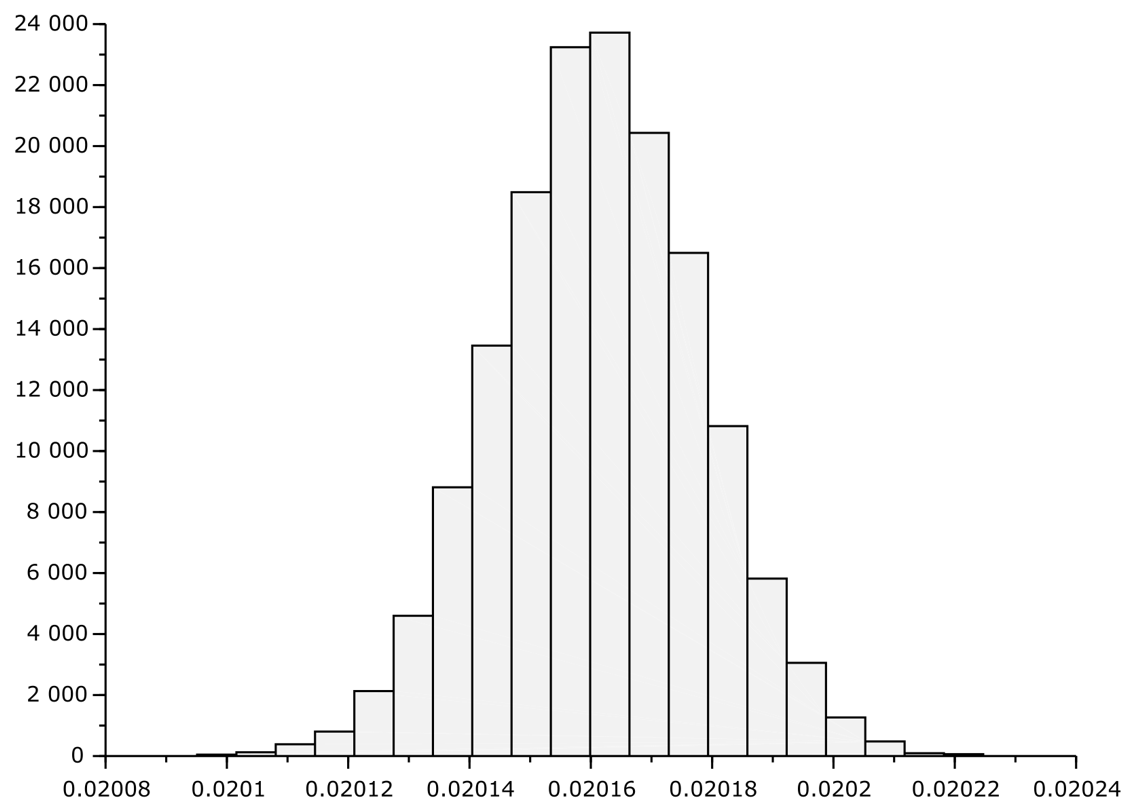
Prototype measurement does not give information about the full extent of the error distribution due to resistor tolerance. Monte-Carlo analysis was conducted to evaluate the error distribution for given resistor tolerance and opamp offset distribution and drift.
Table 11-1 shows the expected error (in that case unadjusted gain error) in case of using resistors with certain tolerance. Note that only R1 to R5 contributes to the accuracy of the current output path.
Table 11-1 Error Dependency on Resistor
Tolerance
| Resistor tolerance | 1% | 0.5% | 0.1% | Ideal Resistors |
|---|---|---|---|---|
| ±3 sigma error | 1.73% | 0.87% | 0.25% | 0.18% |
| Max error | 2.3% | 1% | 0.3% | 0.25% |
 Figure 11-1 Output Current Histogram for
2.5V Input, and 0.5% Resistors