SBOK044B December 2020 – December 2024 TPS7H4010-SEP
- 1
- 1 Abstract
- Trademarks
- 2 Introduction
- 3 Single-Event Effects (SEE)
- 4 Device and Test Board Information
- 5 Irradiation Facility and Setup
- 6 Depth, Range, and LETEFF Calculation
- 7 Test Setup and Procedures
- 8 Destructive Single-Event Effects (DSEE)
- 9 Single-Event Transients (SET)
- 10Event Rate Calculations
- 11Summary
- 12Revision History
- A Total Ionizing Dose from SEE Experiments
- B References
9 Single-Event Transients (SET)
SETs are defined as heavy-ion-induced transients upsets on the VOUT and the PGOOD flag of the TPS7H4010-SEP. SET testing was performed at room temperature (no external temperature control applied). The species used for the SET testing was 84Kr, 63Cu, 40Ar, 20Ne, and 14N for a range of LETEFF = 1.33 to 43 MeV·cm2/mg, for more details refer to Section 6. Flux of approximately 104 ions/cm2·s and a fluence of approximately 3 × 10⁶ ions/cm2 were used for the SET runs.
VOUT SETs were characterized using a window trigger of ±3% around the nominal output voltage (≈1.8 and 3.3 V). The devices were characterized at PVIN = 5 V (for VOUT = 1.8 V) and PVIN = 12 V (for VOUT = 3.3 V). The output load was set to 6 A for both runs by using discrete power resistors of 0.55 Ω (for VOUT = 3.3 V) and 0.3 Ω (for VOUT = 1.8 V). To capture the SETs two NI-PXI-5172 scope card were used to continuously monitor the VOUT and the PGOOD. Each scope was operated independently from each other. The output voltage was monitored by using the TP1 and the TP15 test points on the EVM, while the PGOOD was monitored using the TP11 and TP25 test points. The scope triggering from PGOOD was also monitoring the output voltage. The PGOOD and VOUT were tied together through a 100-kΩ resistor (pull-up).
The scope triggering from VOUT was programmed to record 80k samples with a sample rate of 10 M samples per second (S/s) in case of an event (trigger). The scope triggering from PGOOD was programmed with 30k samples and 5 MS/s. Both scopes were programmed to record 20% of the data before the trigger occured.
Under heavy-ions, the TPS7H4010-SEP exhibits three transient upsets that were fully recoverable without the need for external intervention. Two distinct signatures were observed on the output voltage.
- A fast transient of both polarities (positive and negative) with typical deviation of ≈4.3% and transient times of ≈30 μs. This transients are referred here as VOUTSET.
- A slow transient that drops to zero volts and recover within the programmed soft start time, refer here as SSSEFI.
The SSSEFI is associated with a disturbance on the soft start circuit. During the SSSEFI the soft start circuit discharges the SS capacitor (through an internal FET) and restarted the device. Since no external soft start capacitor was used on the EVM, the internal soft start time of ≈6 ms was observed during this kind of SSSEFI. PGOOD SETs at trigger levels of 300 mV below the nominal output voltage were observed. Since the PGOOD was pulled-up to the output voltage; with each transient on VOUT that droops 300 mV a capture was initiated on the scope triggering from the PGOOD signal. However this was not a real transient on the PGOOD circuit. Since PGOOD circuit is designed to pull-down when the output voltage is not within 10% of the final value, each VOUTSET > |10%| was also captured on the scope triggering from PGOOD. All the data that was captured on this scope was processed to eliminate the intrinsic electronic behavior and the coupling with the output voltage. Those SETs that were true transients on the PGOOD circuitry were compared to half the nominal output voltage. This is valid since PGOOD is typically connected to digital circuits with VIL = 200 mV. After processing, there were no captures for PGOOD that met this condition. Weibull FITs were conducted for each output case (1.8V and 3.3V) as well as each transient type (VOUTSET and SSSEFI). The weibull parameters and FIT plots are shown in table 9-5 and figure 9-1.
Test conditions and results are summarized in Table 9-3. Histograms for the VOUTSET peak normalized deviation and the transient time for run # 9 and # 10 are shown from Figure 9-2 to Figure 9-5, since all the SSSEFI drop to zero. Only the Tt histogram is shown in Figure 9-6 and Figure 9-7. Figure 9-8 to Figure 9-13 show typical time domain plots for all the different types of the observed SETs for VOUT = 1.8 V and VOUT = 3.3 V.
| RUN # | UNIT # | ION | LETEFF (MeV·cm2/mg) | FLUX (ions·cm2·s) | FLUENCE (# ions) | VOUTSET (#) ≥ |3%| | SSSEFI (#) | PGOOD SET ≤ VOUT / 2 |
|---|---|---|---|---|---|---|---|---|
| 9 | 7 | 84Kr | 43 | 1.17 × 10⁴ | 3 × 10⁶ | 686 | 216 | 0 |
10 | 9 | 84Kr | 43.1 | 1.18 x 10⁴ | 3 × 10⁶ | 251 | 248 | 0 |
11 | 9 | 84Kr | 29.7 | 1.09 x 10⁴ | 2.99 × 10⁶ | 192 | 166 | 0 |
12 | 9 | 63Cu | 28.1 | 1.07 x 10⁴ | 3 × 10⁶ | 174 | 165 | 0 |
13 | 9 | 63Cu | 19.7 | 1.08 x 10⁴ | 2.99 × 10⁶ | 184 | 159 | 0 |
14 | 9 | 40Ar | 12 | 1.22 x 10⁴ | 2.99 × 10⁶ | 187 | 72 | 0 |
15 | 9 | 40Ar | 8.44 | 1.18 x 10⁴ | 2.99 × 10⁶ | 153 | 22 | 0 |
16 | 9 | 40Ar | 8.44 | 1.07 x 10⁴ | 3 × 10⁶ | 150 | 19 | 0 |
17 | 9 | 20Ne | 3.89 | 1.12 x 10⁴ | 3 × 10⁶ | 92 | 11 | 0 |
18 | 9 | 20Ne | 2.74 | 1.11 x 10⁴ | 2.99 × 10⁶ | 43 | 5 | 0 |
19 | 9 | 14N | 1.33 | 1.11 x 10⁴ | 2.99 × 10⁶ | 18 | 0 | 0 |
Run # | Unit # | ION | LETEFF (MeV·cm2/mg) | FLUX (ions·cm2·s) | FLUENCE (# ions) | VOUTSET (#) ≥ |3%| | SSSEFI (#) | PGOOD SET ≤ VOUT / 2 |
|---|---|---|---|---|---|---|---|---|
20 | 8 | 84Kr | 43 | 1.05 x 10⁴ | 3 × 10⁶ | 251 | 218 | 0 |
21 | 10 | 84Kr | 43.1 | 1.28 x 10⁴ | 3 × 10⁶ | 448 | 189 | 0 |
22 | 10 | 84Kr | 29.7 | 1.03 x 10⁴ | 2.99 × 10⁶ | 362 | 167 | 0 |
23 | 10 | 63Cu | 28.1 | 9.16 x 10³ | 2.99 × 10⁶ | 398 | 178 | 0 |
24 | 10 | 63Cu | 19.7 | 1.28 x 10⁴ | 3 × 10⁶ | 322 | 145 | 0 |
25 | 10 | 40Ar | 12 | 1.28 x 10⁴ | 2.99 × 10⁶ | 301 | 82 | 0 |
26 | 10 | 40Ar | 8.44 | 1.28 x 10⁴ | 2.99 × 10⁶ | 189 | 31 | 0 |
27 | 10 | 20Ne | 3.89 | 1.13 x 10⁴ | 3 × 10⁶ | 108 | 6 | 0 |
28 | 10 | 20Ne | 2.74 | 1.12 x 10⁴ | 3 × 10⁶ | 84 | 12 | 0 |
29 | 10 | 14N | 1.33 | 9.07 x 10³ | 2.99 × 10⁶ | 24 | 0 | 0 |
Using the MFTF method described in Single-Event Effects (SEE) Confidence Interval Calculations application report, the upper-bound cross-section (using a 95% confidence level) is calculated for the different SETs as shown in Table 9-3 and Table 9-4.
Run # | SET TYPE | # UPSETS | UPPER BOUND CROSS SECTION (cm2/device) | SET TYPE | # UPSETS | UPPER BOUND CROSS SECTION (cm2/device) | SET TYPE | # UPSETS | UPPER BOUND CROSS SECTION (cm2/device) |
|---|---|---|---|---|---|---|---|---|---|
9 | VOUTSET ≥ |3%| | 686 | 2.46 × 10⁻⁴ | SSSEFI | 216 | 8.23 × 10⁻⁵ | PGOOD ≤ 0.9 – V | 0 | 1.23 × 10⁻⁶ |
10 | VOUTSET ≥ |3%| | 251 | 9.47 x 10⁻⁵ | SSSEFI | 248 | 9.36 x 10⁻⁵ | PGOOD ≤ 0.9 – V | 0 | 1.23 x 10⁻⁶ |
11 | VOUTSET ≥ |3%| | 192 | 7.40 x 10⁻⁵ | SSSEFI | 166 | 6.45 x 10⁻⁵ | PGOOD ≤ 0.9 – V | 0 | 1.23 x 10⁻⁶ |
12 | VOUTSET ≥ |3%| | 174 | 6.74 x 10⁻⁵ | SSSEFI | 165 | 6.41 x 10⁻⁵ | PGOOD ≤ 0.9 – V | 0 | 1.23 x 10⁻⁶ |
13 | VOUTSET ≥ |3%| | 184 | 7.11 x 10⁻⁵ | SSSEFI | 159 | 6.21 x 10⁻⁵ | PGOOD ≤ 0.9 – V | 0 | 1.23 x 10⁻⁶ |
14 | VOUTSET ≥ |3%| | 187 | 7.22 x 10⁻⁵ | SSSEFI | 72 | 3.03 x 10⁻⁵ | PGOOD ≤ 0.9 – V | 0 | 1.23 x 10⁻⁶ |
15 | VOUTSET ≥ |3%| | 153 | 6.00 x 10⁻⁵ | SSSEFI | 22 | 1.11 x 10⁻⁵ | PGOOD ≤ 0.9 – V | 0 | 1.23 x 10⁻⁶ |
16 | VOUTSET ≥ |3%| | 150 | 5.87 x 10⁻⁵ | SSSEFI | 19 | 9.89 x 10⁻⁶ | PGOOD ≤ 0.9 – V | 0 | 1.23 x 10⁻⁶ |
17 | VOUTSET ≥ |3%| | 92 | 3.76 x 10⁻⁵ | SSSEFI | 11 | 6.56 x 10⁻⁶ | PGOOD ≤ 0.9 – V | 0 | 1.23 x 10⁻⁶ |
18 | VOUTSET ≥ |3%| | 43 | 1.94 x 10⁻⁵ | SSSEFI | 5 | 3.90 x 10⁻⁶ | PGOOD ≤ 0.9 – V | 0 | 1.23 x 10⁻⁶ |
19 | VOUTSET ≥ |3%| | 18 | 9.51 x 10⁻⁶ | SSSEFI | 0 | 1.23 x 10⁻⁶ | PGOOD ≤ 0.9 – V | 0 | 1.23 x 10⁻⁶ |
Run # | SET TYPE | # UPSETS | UPPER BOUND CROSS SECTION (cm2/device) | SET TYPE | # UPSETS | UPPER BOUND CROSS SECTION (cm2/device) | SET TYPE | # UPSETS | UPPER BOUND CROSS SECTION (cm2/device) |
|---|---|---|---|---|---|---|---|---|---|
20 | VOUTSET ≥ |3%| | 251 | 9.47 × 10⁻⁵ | SSSEFI | 218 | 8.3 × 10⁻⁵ | PGOOD ≤ 0.9 – V | 0 | 1.23 × 10⁻⁶ |
21 | VOUTSET ≥ |3%| | 448 | 1.54 x 10⁻⁴ | SSSEFI | 189 | 7.25 x 10⁻⁵ | PGOOD ≤ 0.9 – V | 0 | 1.23 × 10⁻⁶ |
22 | VOUTSET ≥ |3%| | 362 | 1.34 x 10⁻⁴ | SSSEFI | 167 | 6.50 x 10⁻⁵ | PGOOD ≤ 0.9 – V | 0 | 1.23 × 10⁻⁶ |
23 | VOUTSET ≥ |3%| | 398 | 1.47 x 10⁻⁴ | SSSEFI | 178 | 6.89 x 10⁻⁵ | PGOOD ≤ 0.9 – V | 0 | 1.23 × 10⁻⁶ |
24 | VOUTSET ≥ |3%| | 322 | 1.20 x 10⁻⁴ | SSSEFI | 145 | 5.69 x 10⁻⁵ | PGOOD ≤ 0.9 – V | 0 | 1.23 × 10⁻⁶ |
25 | VOUTSET ≥ |3%| | 301 | 1.13 x 10⁻⁴ | SSSEFI | 82 | 3.40 x 10⁻⁵ | PGOOD ≤ 0.9 – V | 0 | 1.23 × 10⁻⁶ |
26 | VOUTSET ≥ |3%| | 189 | 7.29 x 10⁻⁵ | SSSEFI | 31 | 1.47 x 10⁻⁵ | PGOOD ≤ 0.9 – V | 0 | 1.23 × 10⁻⁶ |
27 | VOUTSET ≥ |3%| | 108 | 4.35 x 10⁻⁵ | SSSEFI | 6 | 4.35 x 10⁻⁶ | PGOOD ≤ 0.9 – V | 0 | 1.23 × 10⁻⁶ |
28 | VOUTSET ≥ |3%| | 84 | 3.46 x 10⁻⁵ | SSSEFI | 12 | 6.98 x 10⁻⁶ | PGOOD ≤ 0.9 – V | 0 | 1.23 × 10⁻⁶ |
29 | VOUTSET ≥ |3%| | 24 | 1.19 x 10⁻⁵ | SSSEFI | 0 | 1.23 × 10⁻⁶ | PGOOD ≤ 0.9 – V | 0 | 1.23 × 10⁻⁶ |
Parameters | 1.8V VOUTSET | 1.8V SSSEFI | 3.3V VOUTSET | 3.3 SSSEFI |
|---|---|---|---|---|
Upper Bound Cross Section (cm2) | 9.47x10⁻⁵ | 9.36x10⁻⁵ | 1.64x10⁻⁴ | 7.27x10⁻⁵ |
Cross-Saturation (cm2) | 8.37x10⁻⁵ | 8.27x10⁻⁵ | 1.49x10⁻⁴ | 6.3x10⁻⁵ |
Onset (MeV·cm2/mg) | 1 | 1.33 | 1 | 1.33 |
w | 11 | 20 | 12 | 16 |
s | 1 | 1.6 | 1 | 2.2 |
 Figure 9-1 Weibull FITs for each VOUT case.
 X-axis is LETEFF and Y-axis is respective upper bound cross section.
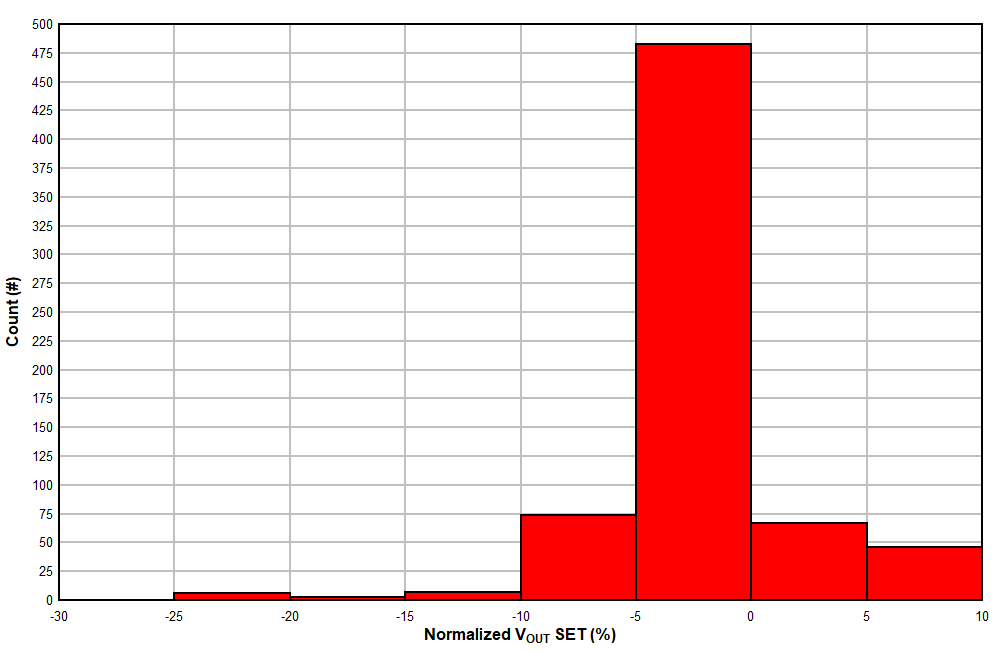 Figure 9-2 Histogram of the Normalized Amplitude for the Positive and Negative VOUT SETs on Run # 9
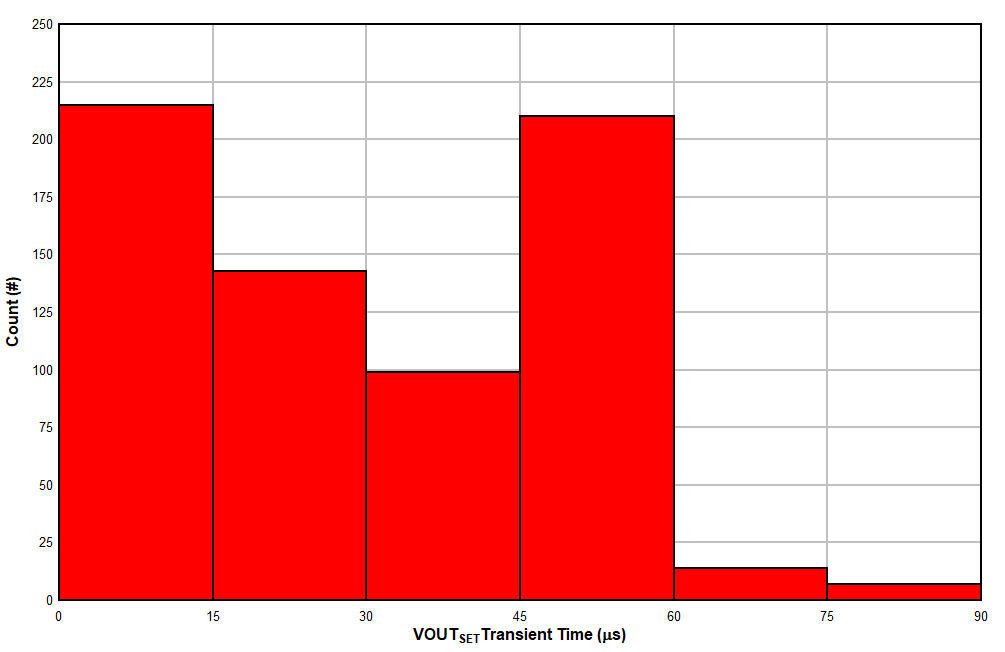 Figure 9-4 Histogram of the Transient Time for VOUT SETs on Run # 9
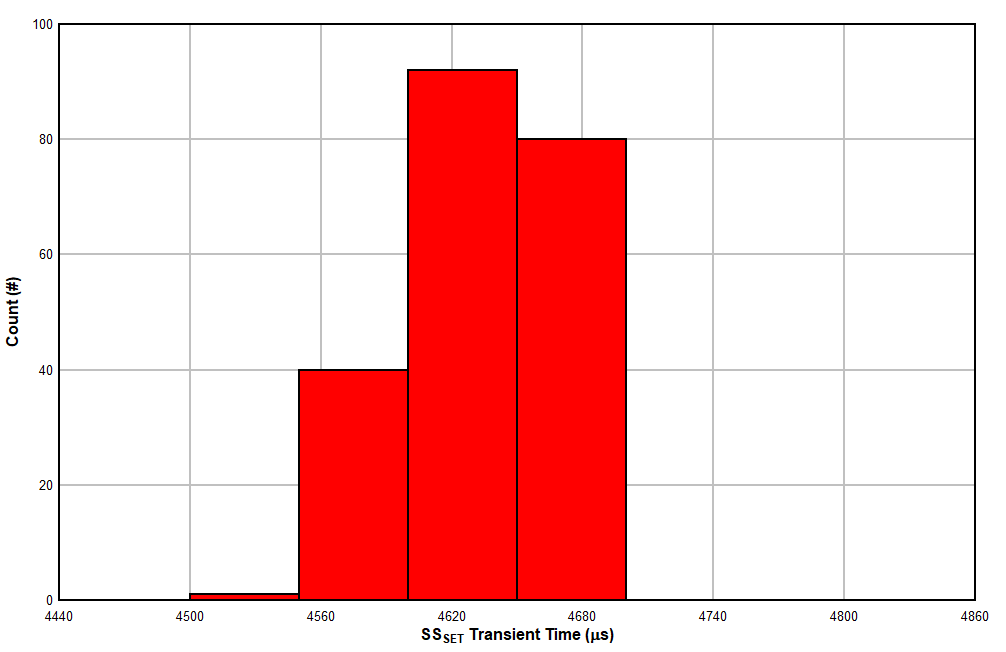 Figure 9-6 Histogram of the Transient Time for SS SETs on Run # 9
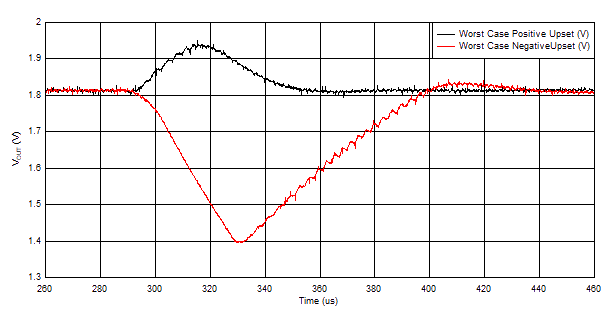 Figure 9-8 Worst Case Positive and Negative Polarity VOUTSET for Run # 9
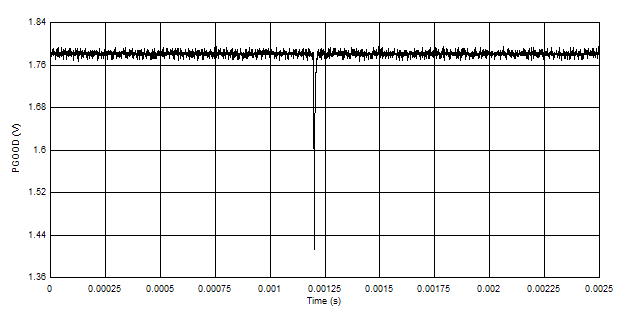 Figure 9-10 Typical PGOODSET ≤ 0.9 V for Run # 9
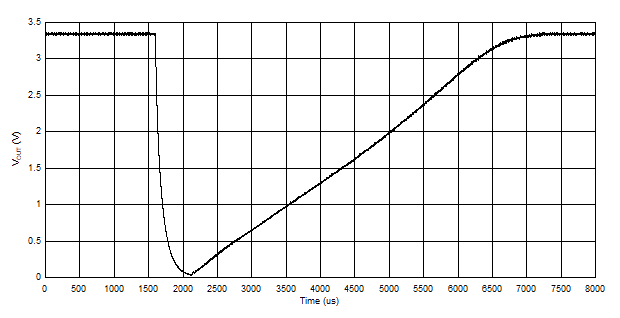 Figure 9-12 Typical VOUT During a SSSET for Run # 10
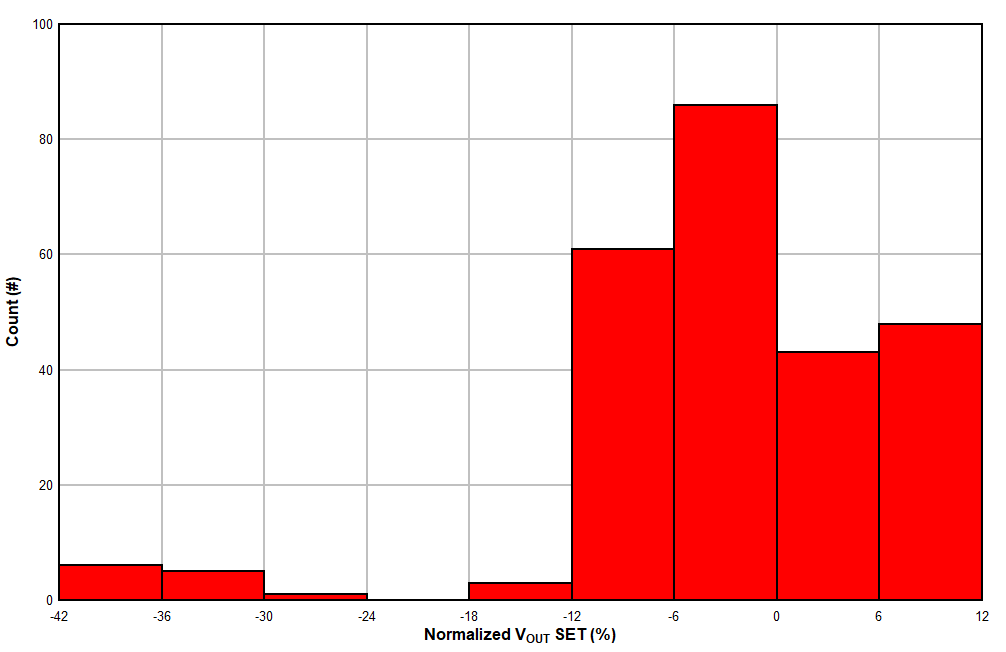 Figure 9-3 Histogram of the Normalized Amplitude for the Positive and Negative VOUT SETs on Run # 10
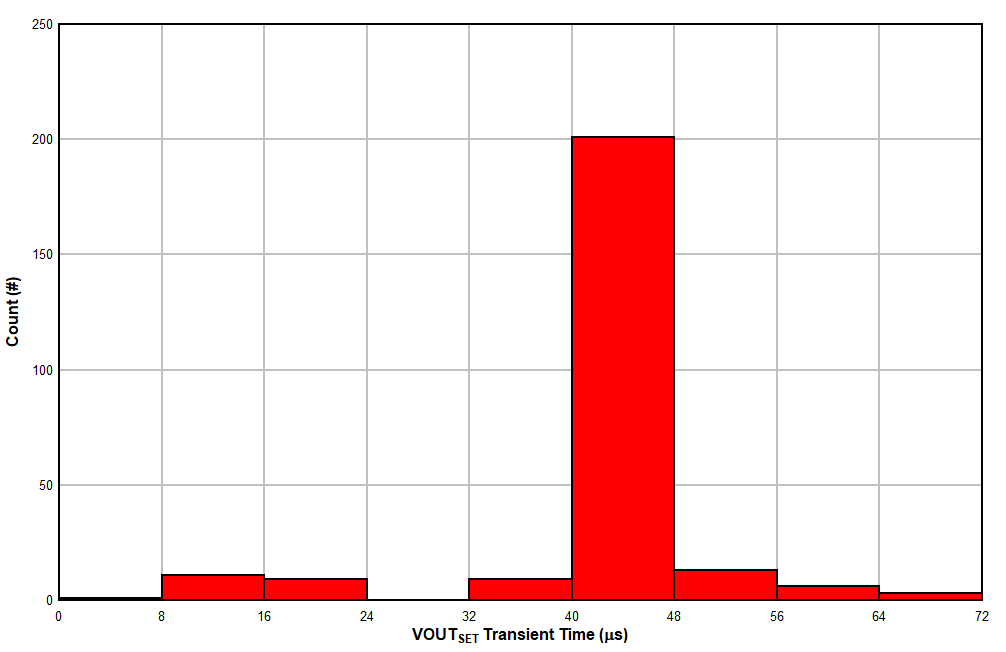 Figure 9-5 Histogram of the Transient Time for VOUT SETs on Run # 10
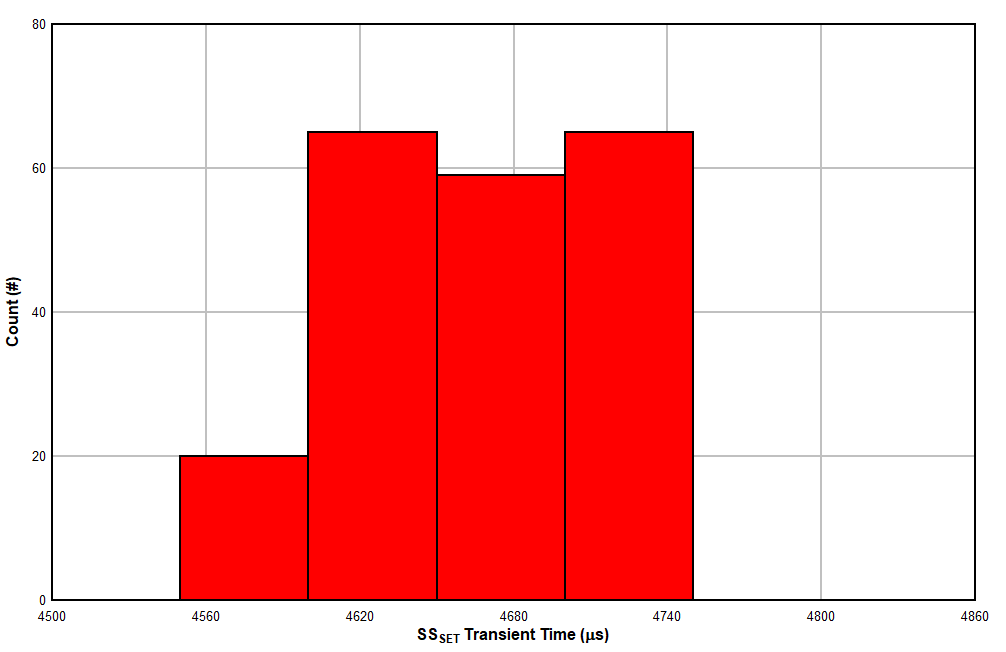 Figure 9-7 Histogram of the Transient Time for SS SETs on Run # 10
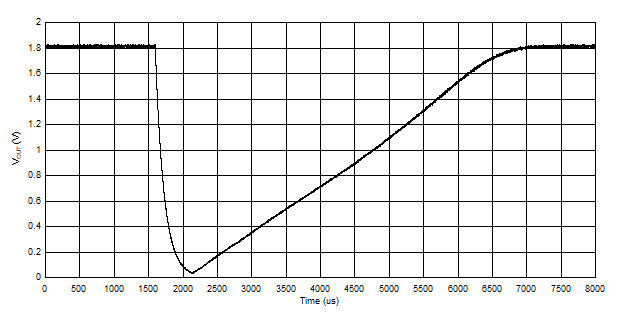 Figure 9-9 Typical VOUT During a SSSEFI for Run # 9
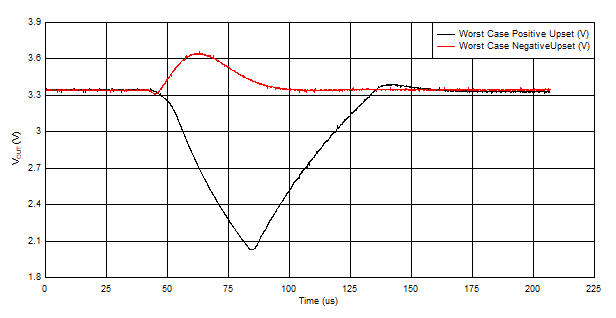 Figure 9-11 Worst Case Positive and Negative Polarity VOUTSET for Run # 10
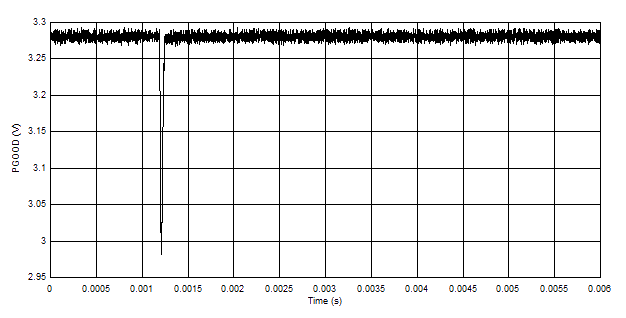 Figure 9-13 Typical PGOODSET ≤ 1.6 V for Run # 10