SLAA513B December   2011  – February 2022 MSP430G2112 , MSP430G2112 , MSP430G2152 , MSP430G2152 , MSP430G2212 , MSP430G2212 , MSP430G2252 , MSP430G2252 , MSP430G2312 , MSP430G2312 , MSP430G2352 , MSP430G2352 , MSP430G2412 , MSP430G2412 , MSP430G2452 , MSP430G2452


  1.   Trademarks
  2. 1Typical Single Time Base Method
  3. 2Multiple Time Base Method
  4. 3Implementing the Multiple Time Base Method in a Custom Application
    1. 3.1 Timer Clock Source Selection
    2. 3.2 Period and Frequency Calculation
    3. 3.3 Duty Cycle Calculation
  5. 4Example Code
    1. 4.1 Method
      1. 4.1.1 ISR for Multiple Frequencies
      2. 4.1.2 ISR for Multiple Frequencies and Duty Cycles (PWM)
    2. 4.2 Included Code Examples
  6. 5Limitations of the Multiple Time Base Method
    1. 5.1 ISR Overhead
    2. 5.2 Maximum Output Frequency vs Number of Signals
    3. 5.3 Power Consumption
  7. 6References
  8. 7Revision History

ISR Overhead

In the single time base method of producing PWMs, the TxCCRx registers do not need to be reloaded and the output is produced automatically without ever having to enter an ISR. This means that after the initial timer configuration there is no software overhead, because everything is handled in hardware. For the multiple time base method, an ISR is entered at the end of each high and low period, adding some software overhead.

While the ISRs in the code examples are kept to the smallest length possible, the required operations which add to the software overhead include:

  • Wake-up time if coming from a low-power mode
  • ISR entry time
  • Decision logic for which TxCCRx triggered the interrupt
  • Decision logic for what part of the cycle (high/low) just finished (when implementing PWMs only)
  • Reloading the TxCCRx register by adding the appropriate period value

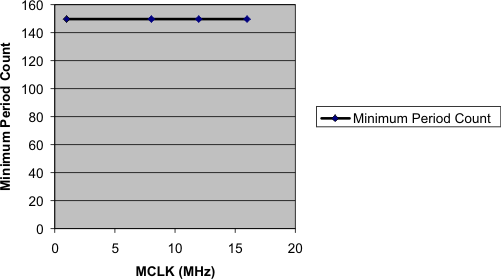
This overhead increases for each signal generated, as this adds to the percentage of time spent in the ISR. Problems occur if the number of cycles spent in the ISR is too great compared to the cycles between ISRs (which is set by your period count value), preventing interrupts from being serviced in a timely manner. Therefore, there is a cutoff point that varies depending on the number of TACCRx registers being used due to the latency added by the ISR code. For a particular number of signals being generated this cutoff point, in terms of number of cycles when the timer clock is being sourced from MCLK, remains essentially constant across MCLK frequencies. This is because the value is an indicator of the ratio between ISR cycles and cycles between interrupts. Figure 5-1 shows the constant relationship of the minimum period count yielding reliable signals versus MCLK. This results in turn in a linear relationship between the maximum output frequency and MCLK, as seen in Figure 5-2.
GUID-7FDB5F22-453E-4A25-9BAD-A1999D601BC4-low.gif
The data in Figure 5-1 was generated from testing on an MSP430G2452 producing three signals of the same period (“worst-case”).
The data points in Figure 5-1 and Figure 5-2 can also be found in Table 5-1.
This data is provided only as a general guideline for the required timer source frequency to produce the desired output frequencies, and should not be regarded as a data sheet specification. Other factors like the other interrupts in the system, the construction of the ISR code, or different frequency and duty cycle combinations may affect the results in a particular application.
Figure 5-1 Minimum Period Count vs MCLK Frequency
GUID-356A1342-BC94-4698-B8B0-04F41B864321-low.gif
The data in Figure 5-2 was generated from testing on an MSP430G2452 producing three signals of the same period (“worst-case”).
The data points in Figure 5-1 and Figure 5-2 can also be found in Table 5-1.
This data is provided only as a general guideline for the required timer source frequency to produce the desired output frequencies, and should not be regarded as a data sheet specification. Other factors like the other interrupts in the system, the construction of the ISR code, or different frequency and duty cycle combinations may affect the results in a particular application.
Figure 5-2 Maximum Output Frequency vs MCLK Frequency
Table 5-1 MSP430G2452 Continuous Mode Performance(1)(2)
MCLK
(MHz)
Minimum Period Count Maximum Frequency
(kHz)
1 150 6.67
8 150 53.33
12 150 80
16 150 106.67
The data in Table 5-1 was generated from testing on an MSP430G2452 producing three signals of the same period (“worst-case”).
This data is provided only as a general guideline for the required timer source frequency to produce the desired output frequencies, and should not be regarded as a data sheet specification. Other factors like the other interrupts in the system, the construction of the ISR code, or different frequency and duty cycle combinations may affect the results in a particular application.