SLAA843A August 2018 – March 2019 MSP430FR2512 , MSP430FR2512 , MSP430FR2522 , MSP430FR2522 , MSP430FR2532 , MSP430FR2532 , MSP430FR2533 , MSP430FR2533 , MSP430FR2632 , MSP430FR2632 , MSP430FR2633 , MSP430FR2633
6.2 Count and Percent Change Analysis With 1.5-mm Overlay, Advice = GOOD
The example in Section 6.1 used the CAPTIVATE-BSWP sensing panel, which is designed for 1.5mm overlay, with a 7.5-mm overlay. This example demonstrates a poor design margin and SNR case. This SNR can be improved in two ways:
- Reducing the parasitic electrode capacitance Cp
- Increasing the touch capacitance Ct
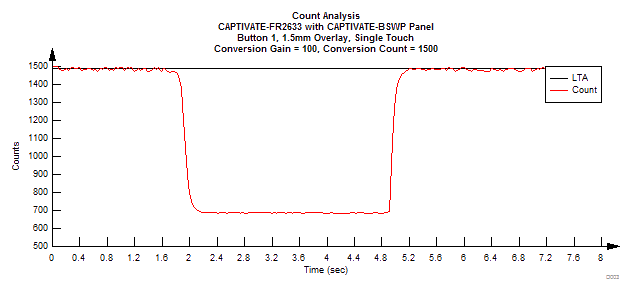
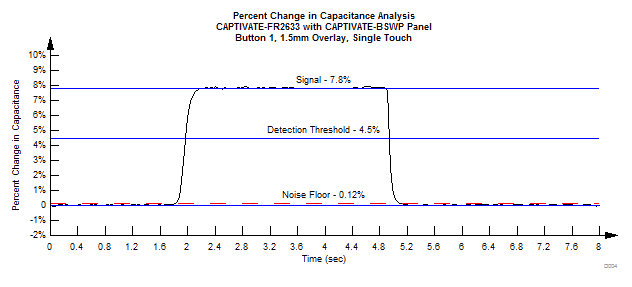
Reducing the overlay thickness has the effect of increasing the touch capacitance Ct, leading to a larger percent change in capacitance due to a touch. With the standard 1.5-mm overlay, the change in counts is now 1490 – 690 = 800 counts, and the signal 'S' improves from 0.82% to a very ideal 7.8% change in capacitance (see Figure 12 and Figure 13).
 Figure 12. Count Analysis With 1.5-mm Overlay
  Figure 13. Percent Change Analysis With 1.5-mm Overlay
 The SNR for this configuration can be calculated by Equation 13.
Figure 13 shows that the Threshold (Th) = 4.5%. Based on Table 4, the minimum recommended threshold for 0°C operating temperature is 0.9% and the Threshold (Th) for this design is 5 times higher than the minimum recommendation. This means that if this example is designed to operate down to 0°C then the SNR analyze tool will give an advice as GOOD.
Equation 14 calculates the Min in this example. In this example, the Min of 4.38% is also 5 times higher than the minimum recommended margin in (Min) 0.83% as showing in Table 4. This means that if this example is designed to operate down to 0°C then the SNR analyze tool will give an advice as GOOD.
Equation 15 calculates the Mout. This is the difference between the lowest percent change during a touch and the detection threshold.
This shows that reducing the overlay thickness by a factor of 5 improved the SNR by a factor of almost 10.