SLAA913A January 2020 – June 2021
3.1 HDC2010 Sensor Readout
Using the Sensor Controller Studio in debug mode, a simple way to test the HDC2010 functionality is to exhale in front of the HDC2010 sensor, which leads to a very large change for the humidity value, while the temperature is barely raising. Putting a finger for a few seconds on the HDC2010 sensor, raises the temperature to about 30.8℃ (all tests were run in an office environment at room temperature). The x axis is time and the unit is second. The y axis is humidity and temperature value. Use the equations in Section 2.2 to calculate the real value.
 Figure 3-1 Temperature and Humidity Curve Under Sensor Controller Studio
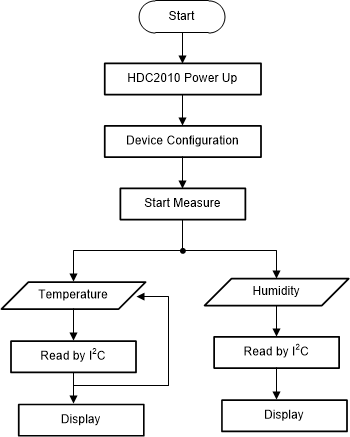
The software flow chart in Figure 3-2 describes the HDC2010 sensor configuration. First, the DIO pin is set to LOW state which opens the P_MOSFET device and the HDC2010 sensor is powered on, then after the minimum start-up time delay several configuration registers are initialized. These register values set the sensor sampling frequency (how often a measurement is made) and the data resolution, here the maximum 14-bit accuracy is set. Finally, the 0x0F register is set to 0x01 to start the measurement. Only 1.24 ms later, both the temperature and humidity value are read out and stored into a data buffer inside the Sensor Controller ULL RAM memory.
The final version of the firmware always keeps the HDC2010 sensor powered as it consumes typically 50 nA in standby mode between temperature and humidity measurements. The complete power-off of the HDC2010 sensor was also implemented and tested. In that case, every HDC2010 readout requires the full initialization cycle and the delay to do the measurement. Depending on the sensor readout period, especially for very long periods of inactivity, power-off can be more power efficient. For the 60 s period analyzed in this report, the standby mode achieved lower power.
 Figure 3-2 Flow Chart of Sensor Controller Engine Firmware