SLAA996A June 2021 – June 2021 TPA6304-Q1
- Trademarks
- 1Introduction
- 2Understanding the Thermal Flow
- 3Understanding the Test and System Conditions
- 4Calculating Dynamic Thermal Dissipation
- 5Designing a Realistic Thermal Test
- 6Thermal Tests
- 7Overall Summary
- 8References
- 9Revision History
6.1 Test Setup
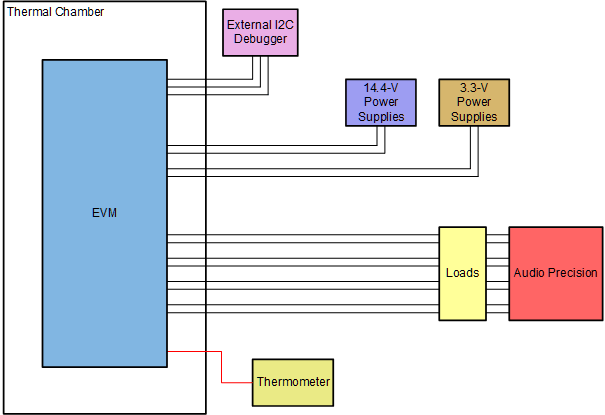 Figure 6-1 Block Diagram of Setup
For each thermal test, the TPA6304Q1EVM was used with the default heatsink (θHA = 2.09°C/W) and Arctic Silver 5 (θCH = 0.19°C/W) is used as the thermal interface.
There were several modifications done to the TPA6304Q1EVM before testing. Referencing to Figure 6-2, Figure 6-3, and Figure 6-4 the LM1086IT-3.3 was bypassed by removing L11 and plugging in a separate 3.3V supplies. The XMOS controller was disabled using S2 and removing the jumper on J3. This was done to remove any additional heat that would have been generated from those devices and could distort the thermal measurements of the audio amplifier.
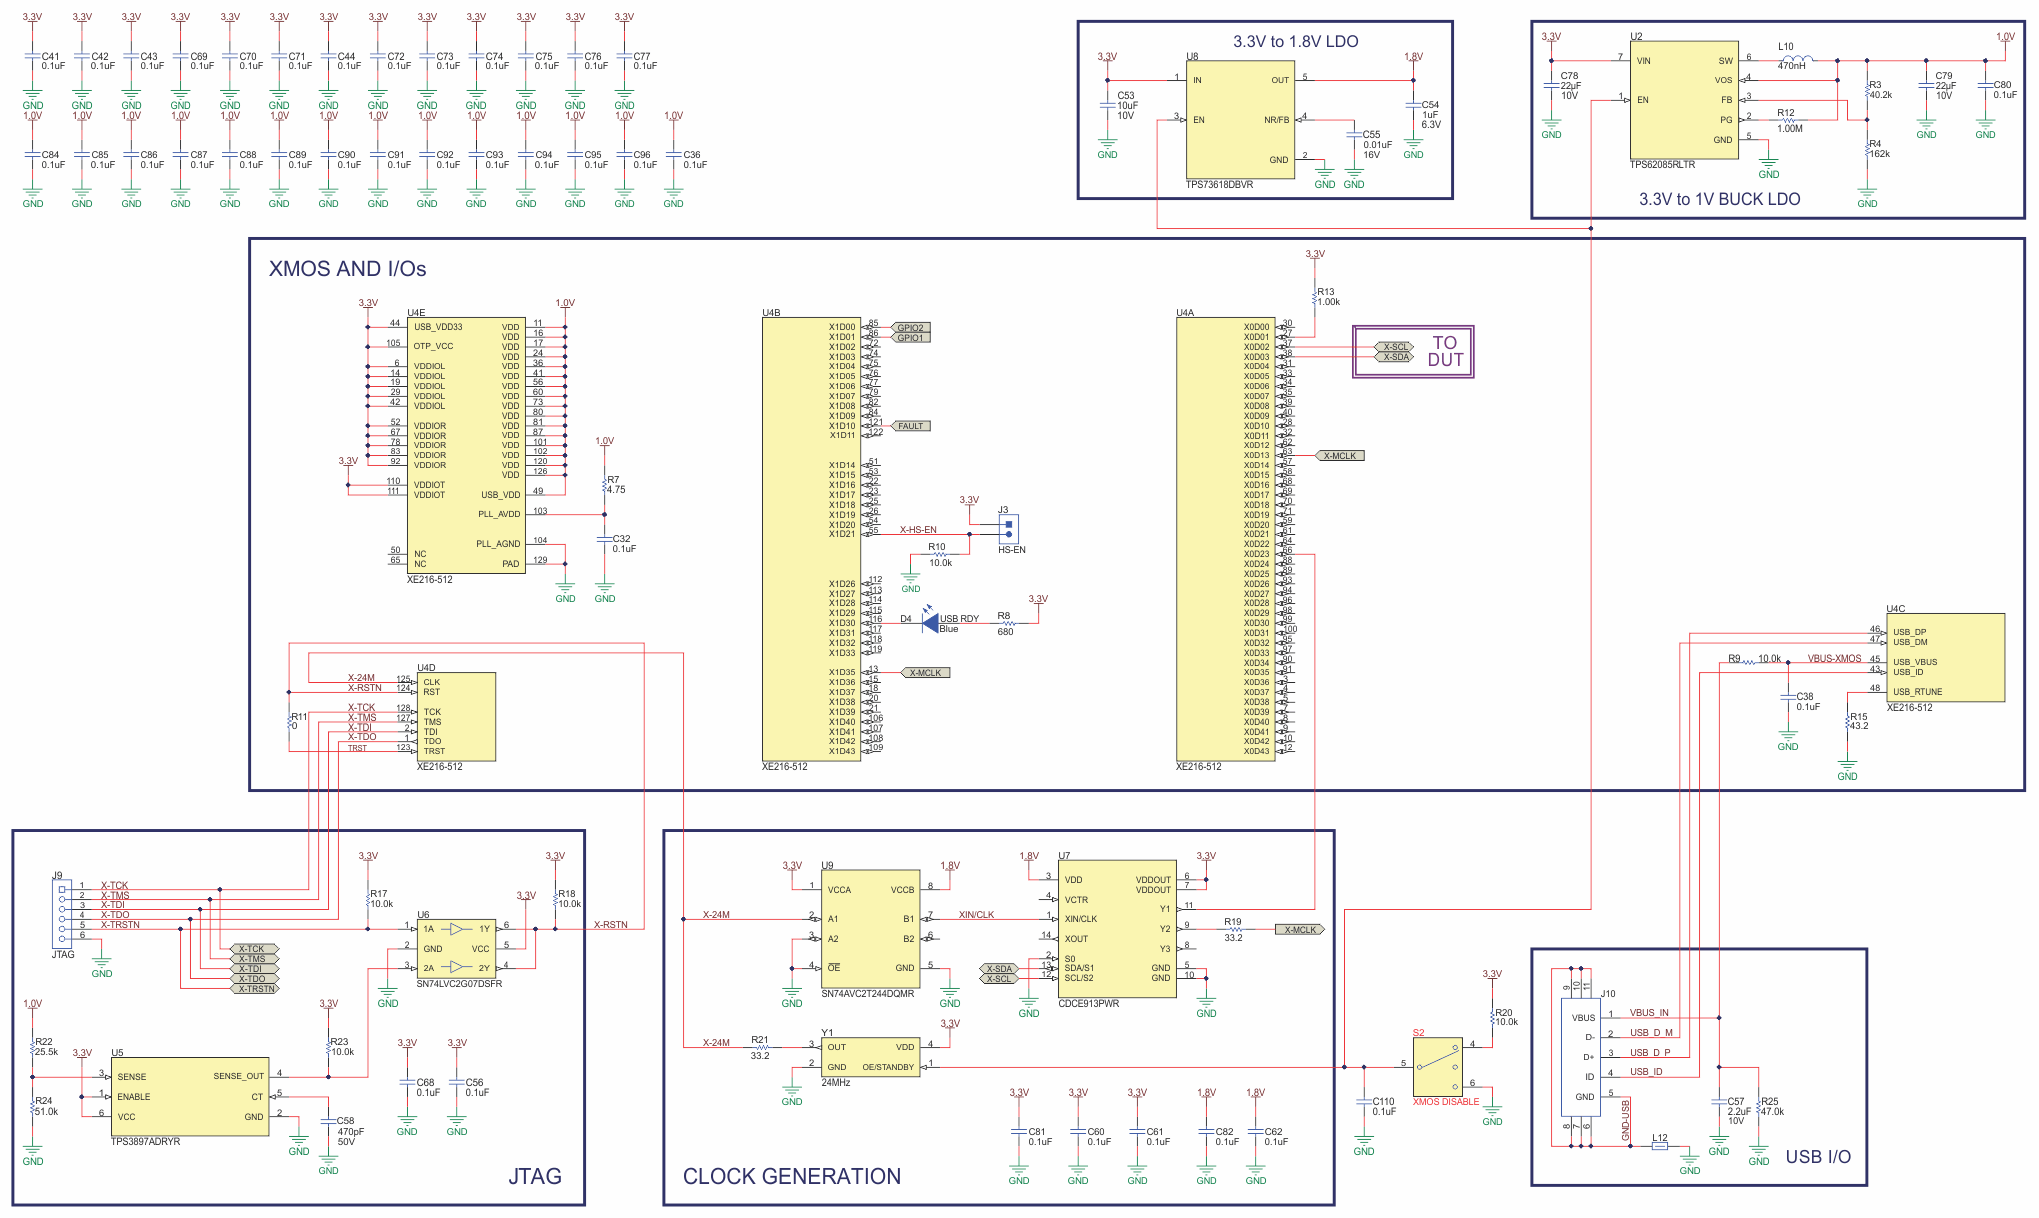 Figure 6-2 TPA6304Q1EVM Schematic (Page
1)
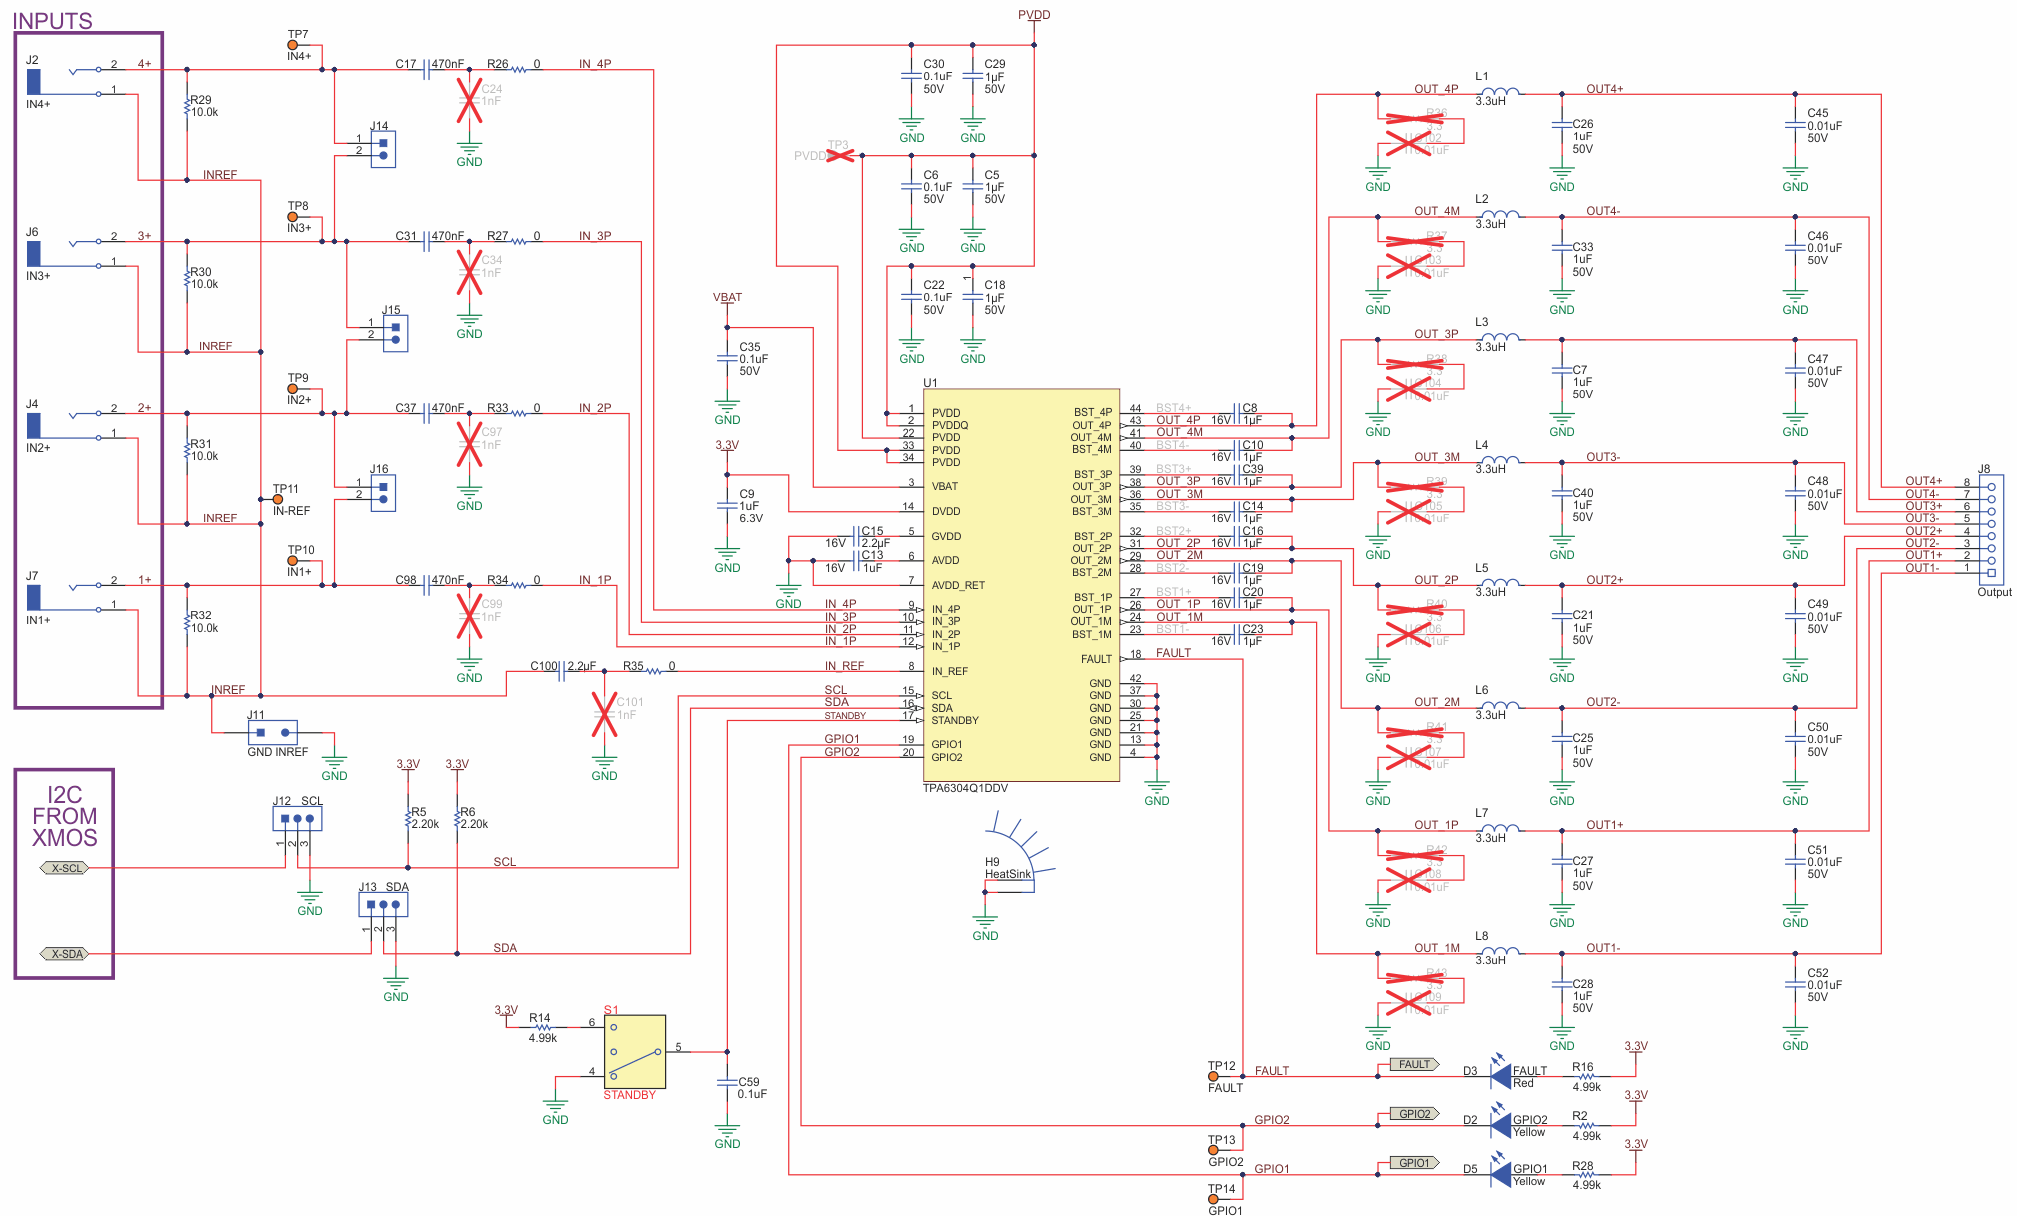 Figure 6-3 TPA6304Q1EVM Schematic (Page
2)
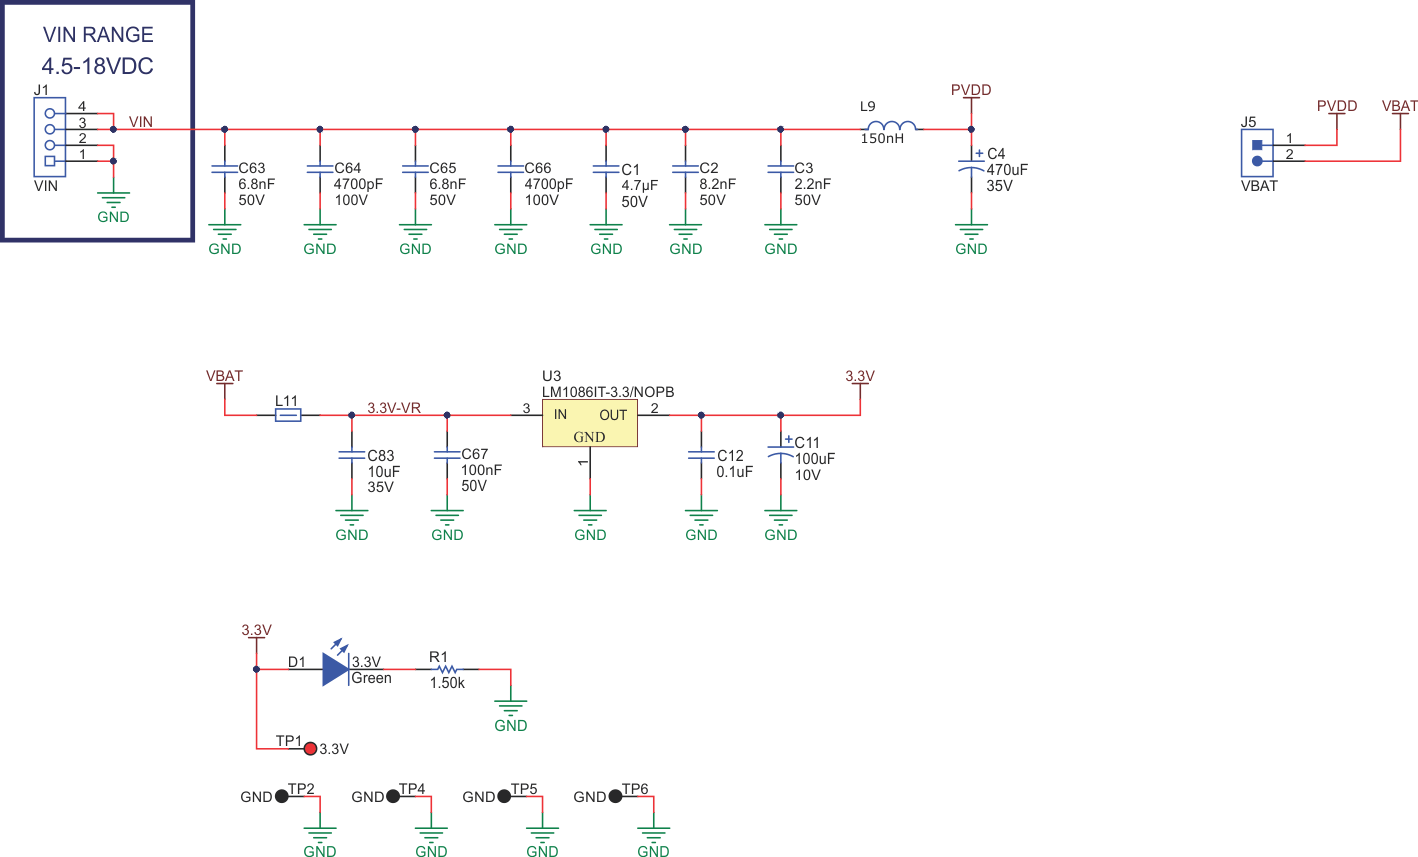 Figure 6-4 TPA6304Q1EVM Schematic (Page
3)
Figure 6-4 TPA6304Q1EVM Schematic (Page
3)To monitor the temperature of the device case, a hole was drilled in the center of the heatsink large enough to place a thermocouple sensor, as seen in Figure 6-5. This thermocouple checks the temperature of the case's thermal pad over the course of the test and determines when the device reaches thermal equilibrium.
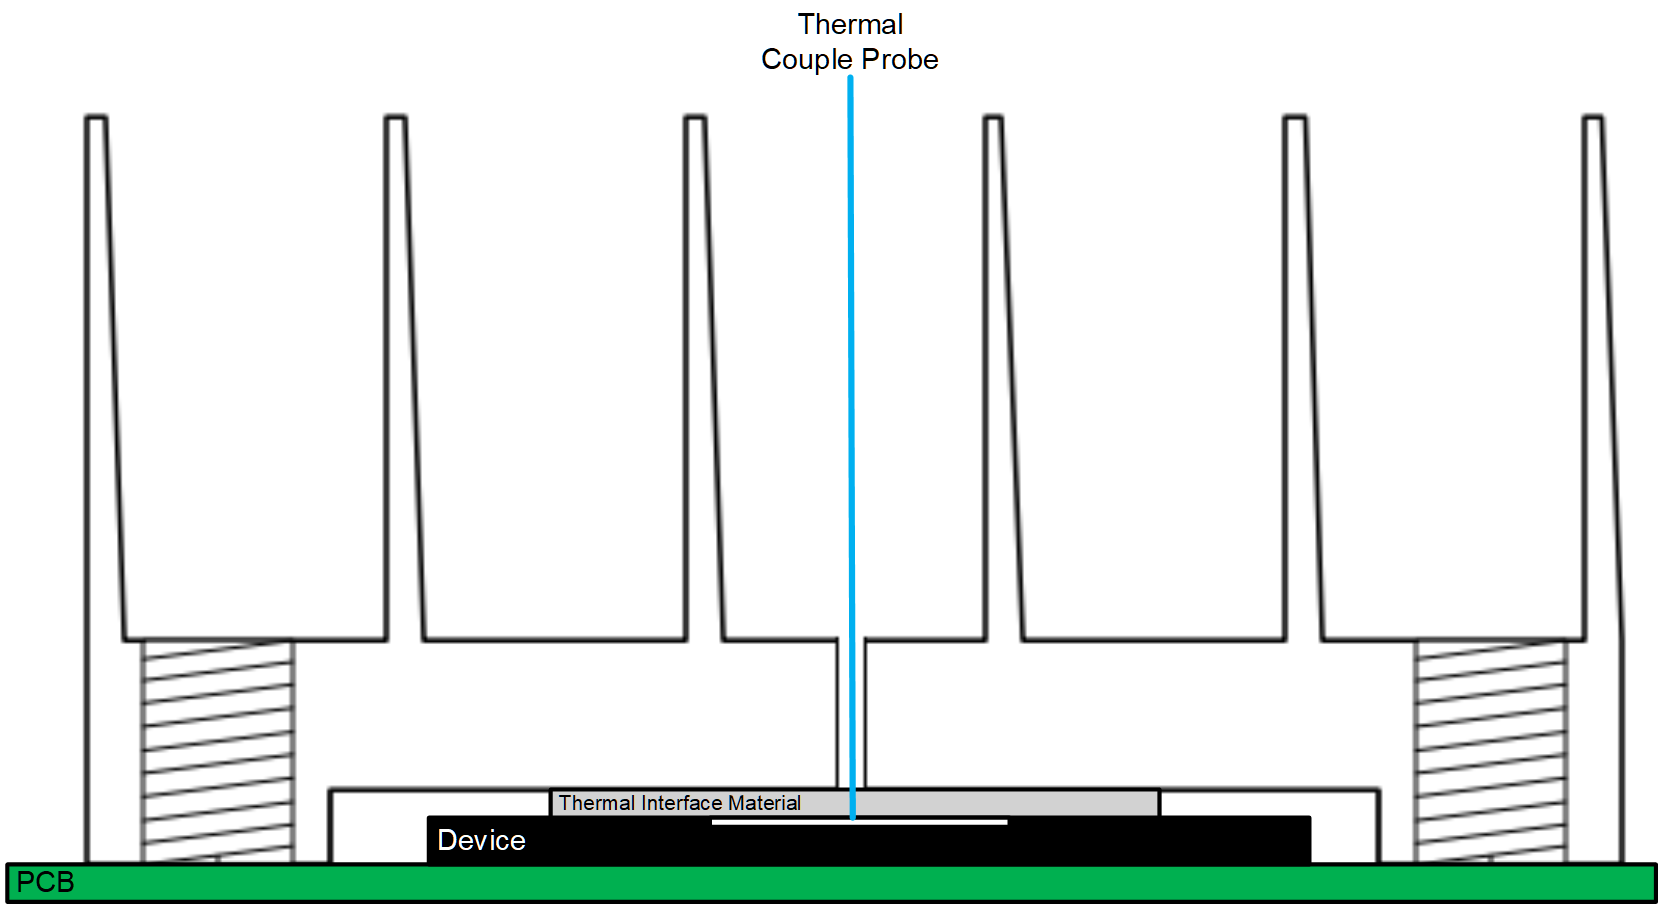 Figure 6-5 Cross-Sectional View of the
System
Figure 6-5 Cross-Sectional View of the
SystemThe test will run until the system reaches thermal equilibrium. Thermal equilibrium was defined in these tests as a temperature change of less than 1°C after 10 minutes.
To ensure that the ambient temperature on the heatsink remained consistent, the test was taken in a thermal chamber.