SLAAED0 March 2024 TAS2764 , TAS2780 , TAS2781
- 1
- Abstract
- Trademarks
- 1 Introduction
- 2 Measurement Methodology
- 3 Introduction to Noise-gate and Pop in Class-D Amplifiers
- 4 Causes of Pop in TAS27xx family of Class-D Amplifiers
- 5 Click and Pop Using TAS27xx
-
6 Click and Pop Measurement Technique Using
AP v6.0. 2
- 6.1 Measurement Setup
- 6.2 Filter Settings
- 6.3 Data Capture Settings
- 6.4 Auto Range Settings for Pop Measurement
- 6.5 ASI or I2S Configurations for Pop Measurement
- 6.6 APx Sound Level Meter Utility
- 6.7 Data Acquisition
- 6.8 Interpreting Click and Pop Waveforms
- 6.9 Post Processing of AP Waveforms
- 6.10 A-Weighted Click and Pop Numbers
- 6.11 Exporting the A-Weighted Numbers
- 7 Noise-Gate Pop and Measurement Technique Using APx
- 8 Configuring TAS2764 for Improved Click and Pop Noise Performance
- 9 Summary
- 10References
6.9 Post Processing of AP Waveforms
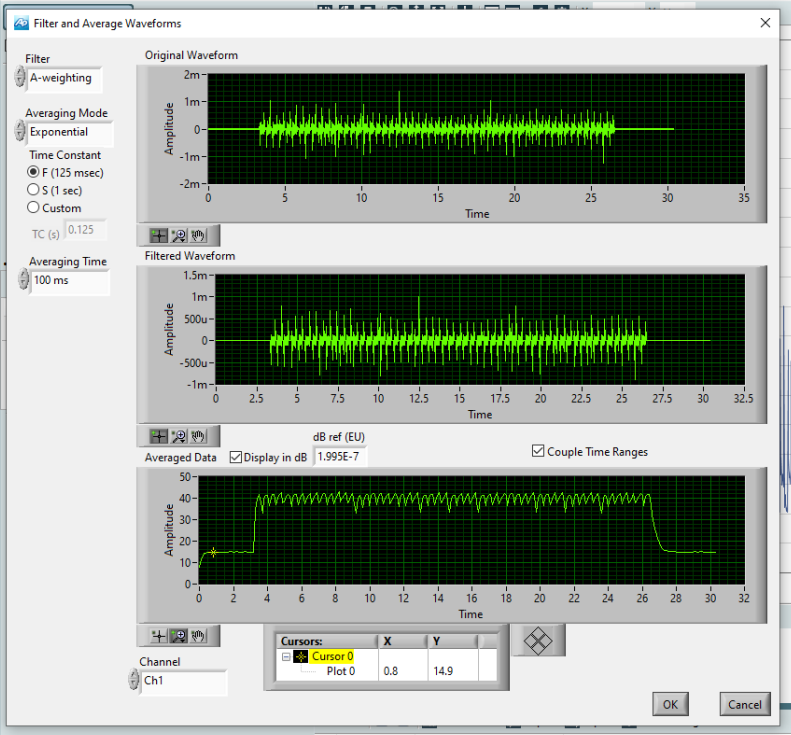
Once the acquisition is over, click the Analyze button on the APX Sound Level Meter (SLM) utility tool. This opens up another window titled Filter and Average Waveforms with three views: the original data, the data after it has been passed through an optional A weighting filter, and the data after it has been averaged. If you change the filter, time constant, and averaging settings in the window, the graphs automatically redraw. SLM utility takes the raw data saved as file by the measurement recorder, processed the data (Filtering and Averaging), and displayed the data as two different waveforms along with original waveform in the window as shown in Figure 6-13.
 Figure 6-13 Filter and Average Waveform
Window – SLM Utility Analyze Output