SLOA294A June 2020 – April 2024 TPS3851-Q1 , TPS7A16A-Q1
- 1
- Abstract
- Trademarks
- 1 Introduction
- 2 Types of Faults and Quantitative Random Hardware Failure Metrics
- 3 Random Failures Over a Product Lifetime and Estimation of BFR
- 4 BFR Estimation Techniques
- 5 Siemens SN 29500 FIT model
- 6 IEC TR 62380
- 7 Recommended Assumptions for BFR Calculations
- 8 Special Considerations for Transient Faults
- 9 BFR Differences (Due to Package) Between IEC TR 62380 and SN 29500
- 10Effect of Power-on Hours on BFR
- 11What Can You Expect for TI Products
- 12Summary
- 13References
- 14Revision History
3 Random Failures Over a Product Lifetime and Estimation of BFR
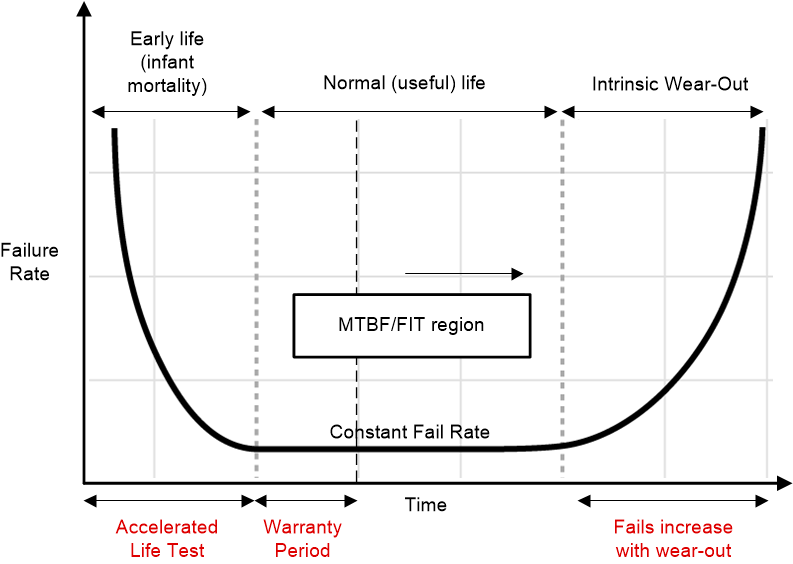
Figure 3-1 shows the bathtub curve, a classic representation of random hardware faults over three key periods of a semiconductor product’s lifetime. These are:
- Early life failures (also known as infant mortality): characterized by a relatively higher initial failure rate, which reduces rapidly. It is possible to further minimize early life failures by performing accelerated life tests (like burn-in or IDDQ testing) which are done as a part of Texas Instruments (TI) outgoing test in the factory. Early-life failures are primarily caused by manufacturing defects that are not effectively screened. Defects are unavoidable. Developing and continuously improving effective screening is a requirement.
- Normal life failures:This is the region of the bath tub curve where the failure rate is relatively low and constant. BFR estimations address this portion of the semiconductor component’s lifecycle. This failure rate is quantified in units of Failure In Time (FIT) – which is an estimate of the number of failures that can occur in a billion (109) cumulative hours of the product’s operation.
- Intrinsic wear-out: This is a period of the product’s lifecycle when intrinsic wear-out dominates and failures increase exponentially. The end of a product’s useful lifetime is specified as the time of onset of wear-out. These types of failures are caused by well-known factors such as channel-hot-carrier effects, electromigration, time-dependent dielectric breakdown and negative bias temperature instability. Functional safety standards such as ISO 26262 and IEC 61508 do not support the calculation of random hardware metrics based on a nonconstant fail rate. Consequently, a constant (but pessimistic) approximation over a product’s lifetime is used to estimate BFR.
The system integrator has to contend with random hardware faults during normal useful life as well as the onset of wear-out. In such circumstances, system integrators must rely on safety mechanisms, which provide a certain diagnostic coverage and lower the risk (which is determined by severity, exposure, and controllability) to an acceptable value.
 Figure 3-1 The Bathtub Curve is a Classic
Representation of Random Hardware Faults