SLUAAA1 October 2021 BQ21061 , BQ21062 , BQ24179 , BQ25150 , BQ25155 , BQ25157 , BQ25672 , BQ25790 , BQ25792 , BQ25798 , BQ25882 , BQ25883 , BQ25887 , BQ25895 , BQ25896 , BQ25898 , BQ25898D
2 Battery Characterization
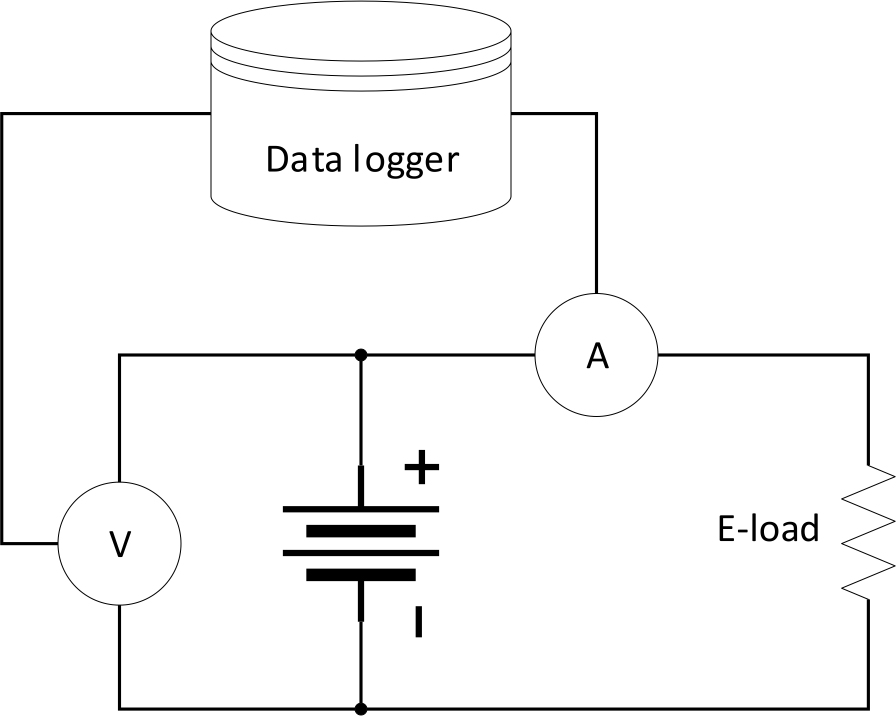
The following steps must be taken to generate the voltage versus SOC table. This setup requires a voltmeter, ammeter, electronic load, and appropriate data logging equipment. Figure 2-1 shows a diagram of the test setup.
 Figure 2-1 Test Setup
- Ensure the battery is charged to full per its manufacturer’s specification.
- Connect the voltmeter to positive battery terminal.
- Connect the electronic load to positive battery terminal with ammeter in series.
- Ensure logging software is turned on and the voltage and current readings are being taken at regular intervals (every 5 to 10 seconds is okay).
- Set load to your applications typical discharge rate and discharge battery to its end-of-discharge voltage.
A C/10 value or less is ideal to minimize the effects of relaxation. Note this process takes a while (> 10 hours). There are more comments on this assumption in the Best Use Cases section.